| Full name: cytochrome P450 family 19 subfamily A member 1 | Alias Symbol: ARO|P-450AROM|CPV1|ARO1|CYAR|aromatase | ||
| Type: protein-coding gene | Cytoband: 15q21.2 | ||
| Entrez ID: 1588 | HGNC ID: HGNC:2594 | Ensembl Gene: ENSG00000137869 | OMIM ID: 107910 |
| Related drugs: ALENDRONIC ACID, AMINOGLUTETHIMIDE, ANASTROZOLE, ANDROSTENEDIONE, ASCORBATE, ATAMESTANE, ATROPINE, AZALANSTAT, AZTREONAM, CAPTOPRIL... [more] | |||
CYP19A1 involved pathways:
| KEGG pathway | Description | View |
|---|---|---|
| hsa04913 | Ovarian steroidogenesis |
Expression of CYP19A1:
| Dataset | Gene | EntrezID | Probe | Log2FC | Adj.pValue | Expression |
|---|---|---|---|---|---|---|
| GSE17351 | CYP19A1 | 1588 | 1560295_at | 0.0482 | 0.8699 | |
| GSE20347 | CYP19A1 | 1588 | 203475_at | -0.0589 | 0.4114 | |
| GSE23400 | CYP19A1 | 1588 | 203475_at | -0.2024 | 0.0000 | |
| GSE26886 | CYP19A1 | 1588 | 240705_at | 0.1531 | 0.3039 | |
| GSE29001 | CYP19A1 | 1588 | 203475_at | -0.0572 | 0.7562 | |
| GSE38129 | CYP19A1 | 1588 | 203475_at | -0.1257 | 0.0297 | |
| GSE45670 | CYP19A1 | 1588 | 240705_at | 0.0587 | 0.5156 | |
| GSE53622 | CYP19A1 | 1588 | 26673 | 0.5091 | 0.0000 | |
| GSE53624 | CYP19A1 | 1588 | 26673 | 0.9596 | 0.0000 | |
| GSE63941 | CYP19A1 | 1588 | 1560295_at | 0.2206 | 0.1412 | |
| GSE77861 | CYP19A1 | 1588 | 240705_at | -0.0021 | 0.9885 | |
| SRP133303 | CYP19A1 | 1588 | RNAseq | 1.0404 | 0.0346 | |
| TCGA | CYP19A1 | 1588 | RNAseq | 1.1421 | 0.0008 |
Upregulated datasets: 2; Downregulated datasets: 0.
Survival by CYP19A1 expression:
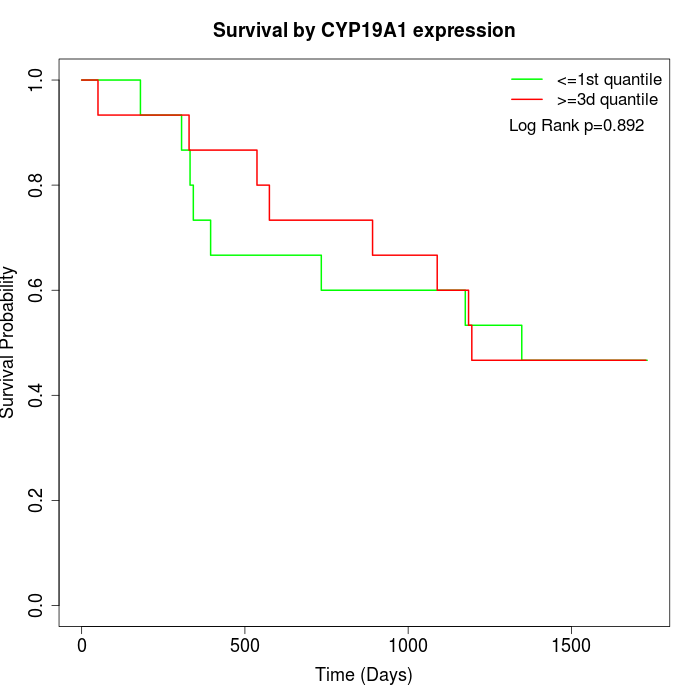 | 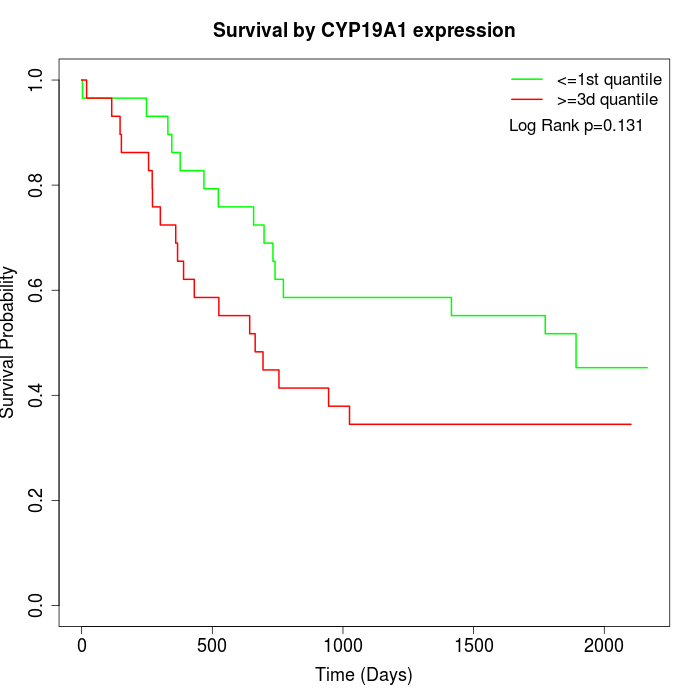 |  |
| GSE53622 | GSE53624 | TCGA |
Note: Click image to view full size file.
Copy number change of CYP19A1:
| Dataset | Gene | EntrezID | Gain | Loss | Normal | Detail |
|---|---|---|---|---|---|---|
| GSE15526 | CYP19A1 | 1588 | 5 | 3 | 22 | |
| GSE20123 | CYP19A1 | 1588 | 5 | 3 | 22 | |
| GSE43470 | CYP19A1 | 1588 | 5 | 3 | 35 | |
| GSE46452 | CYP19A1 | 1588 | 3 | 7 | 49 | |
| GSE47630 | CYP19A1 | 1588 | 8 | 10 | 22 | |
| GSE54993 | CYP19A1 | 1588 | 4 | 6 | 60 | |
| GSE54994 | CYP19A1 | 1588 | 5 | 7 | 41 | |
| GSE60625 | CYP19A1 | 1588 | 4 | 0 | 7 | |
| GSE74703 | CYP19A1 | 1588 | 5 | 2 | 29 | |
| GSE74704 | CYP19A1 | 1588 | 2 | 3 | 15 | |
| TCGA | CYP19A1 | 1588 | 9 | 18 | 69 |
Total number of gains: 55; Total number of losses: 62; Total Number of normals: 371.
Somatic mutations of CYP19A1:
Generating mutation plots.
Highly correlated genes for CYP19A1:
Showing top 20/751 corelated genes with mean PCC>0.5.
| Gene1 | Gene2 | Mean PCC | Num. Datasets | Num. PCC<0 | Num. PCC>0.5 |
|---|---|---|---|---|---|
| CYP19A1 | GLYAT | 0.740178 | 4 | 0 | 4 |
| CYP19A1 | ZMAT4 | 0.736114 | 3 | 0 | 3 |
| CYP19A1 | G6PC2 | 0.732951 | 4 | 0 | 4 |
| CYP19A1 | NPHS2 | 0.727522 | 4 | 0 | 4 |
| CYP19A1 | JAKMIP1 | 0.727488 | 3 | 0 | 3 |
| CYP19A1 | P2RX6 | 0.718532 | 5 | 0 | 5 |
| CYP19A1 | ZNF717 | 0.713722 | 4 | 0 | 4 |
| CYP19A1 | IFT122 | 0.713252 | 3 | 0 | 3 |
| CYP19A1 | OR10H3 | 0.710687 | 4 | 0 | 4 |
| CYP19A1 | FGF23 | 0.708211 | 4 | 0 | 4 |
| CYP19A1 | PSG2 | 0.697506 | 4 | 0 | 4 |
| CYP19A1 | GALNT8 | 0.695739 | 4 | 0 | 4 |
| CYP19A1 | FSCN3 | 0.69375 | 4 | 0 | 4 |
| CYP19A1 | MS4A12 | 0.692585 | 5 | 0 | 5 |
| CYP19A1 | ATG10 | 0.691264 | 4 | 0 | 4 |
| CYP19A1 | MAS1 | 0.687599 | 5 | 0 | 4 |
| CYP19A1 | ABCB11 | 0.683075 | 4 | 0 | 4 |
| CYP19A1 | PHF7 | 0.68099 | 4 | 0 | 4 |
| CYP19A1 | BRINP2 | 0.680327 | 4 | 0 | 3 |
| CYP19A1 | PRL | 0.679809 | 5 | 0 | 5 |
For details and further investigation, click here