| Full name: TBC1 domain family member 13 | Alias Symbol: FLJ10743 | ||
| Type: protein-coding gene | Cytoband: 9q34.11 | ||
| Entrez ID: 54662 | HGNC ID: HGNC:25571 | Ensembl Gene: ENSG00000107021 | OMIM ID: 616218 |
Expression of TBC1D13:
| Dataset | Gene | EntrezID | Probe | Log2FC | Adj.pValue | Expression |
|---|---|---|---|---|---|---|
| GSE17351 | TBC1D13 | 54662 | 44696_at | 0.2667 | 0.3296 | |
| GSE20347 | TBC1D13 | 54662 | 44696_at | 0.0607 | 0.5860 | |
| GSE23400 | TBC1D13 | 54662 | 44696_at | 0.0425 | 0.2220 | |
| GSE26886 | TBC1D13 | 54662 | 44696_at | 0.1826 | 0.2916 | |
| GSE29001 | TBC1D13 | 54662 | 44696_at | 0.0011 | 0.9953 | |
| GSE38129 | TBC1D13 | 54662 | 44696_at | -0.0369 | 0.8040 | |
| GSE45670 | TBC1D13 | 54662 | 44696_at | 0.1405 | 0.2468 | |
| GSE53622 | TBC1D13 | 54662 | 104082 | -0.1861 | 0.0616 | |
| GSE53624 | TBC1D13 | 54662 | 104082 | 0.2396 | 0.0003 | |
| GSE63941 | TBC1D13 | 54662 | 44696_at | -0.3817 | 0.3141 | |
| GSE77861 | TBC1D13 | 54662 | 218596_at | -0.0139 | 0.9592 | |
| GSE97050 | TBC1D13 | 54662 | A_23_P94660 | -0.3825 | 0.1834 | |
| SRP007169 | TBC1D13 | 54662 | RNAseq | 0.1010 | 0.8025 | |
| SRP008496 | TBC1D13 | 54662 | RNAseq | 0.2884 | 0.3158 | |
| SRP064894 | TBC1D13 | 54662 | RNAseq | 0.5627 | 0.0138 | |
| SRP133303 | TBC1D13 | 54662 | RNAseq | -0.1498 | 0.4606 | |
| SRP159526 | TBC1D13 | 54662 | RNAseq | 0.3505 | 0.1152 | |
| SRP193095 | TBC1D13 | 54662 | RNAseq | 0.2834 | 0.0089 | |
| SRP219564 | TBC1D13 | 54662 | RNAseq | -0.0213 | 0.9455 | |
| TCGA | TBC1D13 | 54662 | RNAseq | -0.1853 | 0.0006 |
Upregulated datasets: 0; Downregulated datasets: 0.
Survival by TBC1D13 expression:
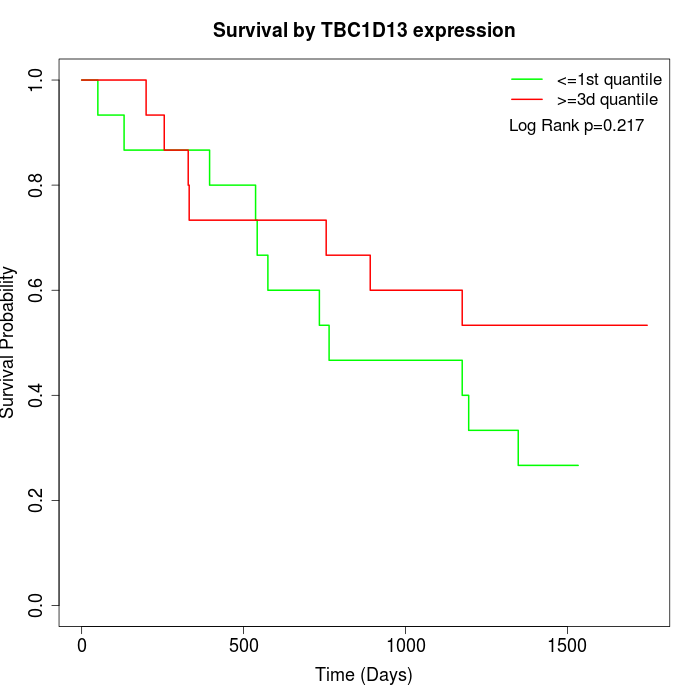 | 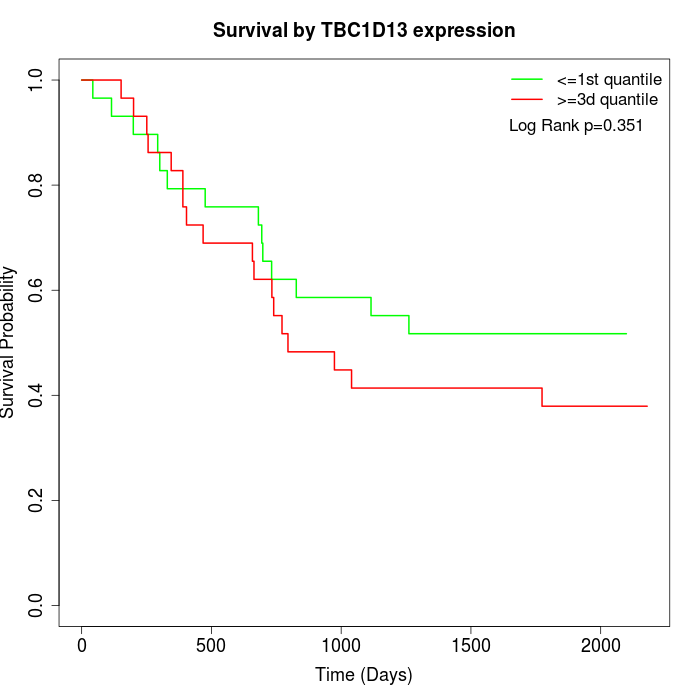 | 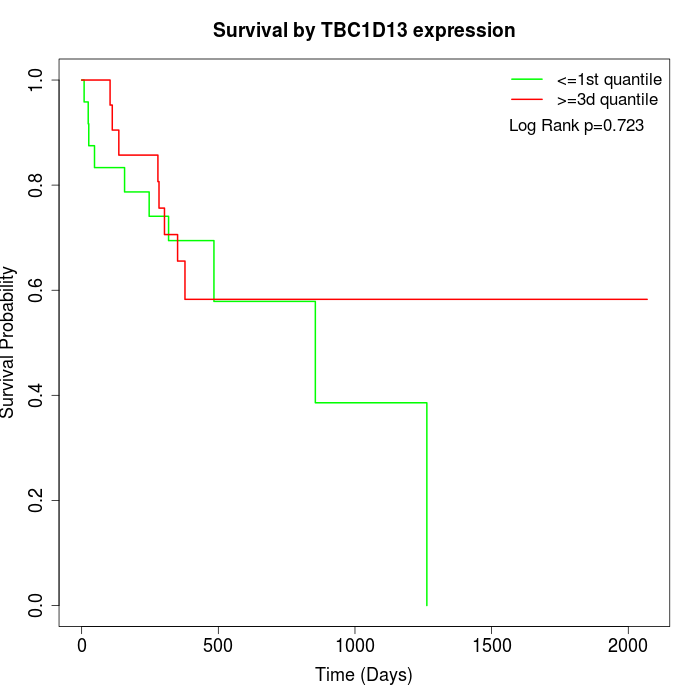 |
| GSE53622 | GSE53624 | TCGA |
Note: Click image to view full size file.
Copy number change of TBC1D13:
| Dataset | Gene | EntrezID | Gain | Loss | Normal | Detail |
|---|---|---|---|---|---|---|
| GSE15526 | TBC1D13 | 54662 | 6 | 9 | 15 | |
| GSE20123 | TBC1D13 | 54662 | 6 | 9 | 15 | |
| GSE43470 | TBC1D13 | 54662 | 5 | 8 | 30 | |
| GSE46452 | TBC1D13 | 54662 | 6 | 13 | 40 | |
| GSE47630 | TBC1D13 | 54662 | 3 | 16 | 21 | |
| GSE54993 | TBC1D13 | 54662 | 3 | 3 | 64 | |
| GSE54994 | TBC1D13 | 54662 | 11 | 8 | 34 | |
| GSE60625 | TBC1D13 | 54662 | 0 | 0 | 11 | |
| GSE74703 | TBC1D13 | 54662 | 5 | 6 | 25 | |
| GSE74704 | TBC1D13 | 54662 | 3 | 7 | 10 | |
| TCGA | TBC1D13 | 54662 | 27 | 24 | 45 |
Total number of gains: 75; Total number of losses: 103; Total Number of normals: 310.
Somatic mutations of TBC1D13:
Generating mutation plots.
Highly correlated genes for TBC1D13:
Showing top 20/68 corelated genes with mean PCC>0.5.
| Gene1 | Gene2 | Mean PCC | Num. Datasets | Num. PCC<0 | Num. PCC>0.5 |
|---|---|---|---|---|---|
| TBC1D13 | HSD11B1L | 0.75031 | 3 | 0 | 3 |
| TBC1D13 | NEURL1B | 0.68895 | 3 | 0 | 3 |
| TBC1D13 | BAX | 0.648008 | 3 | 0 | 3 |
| TBC1D13 | CELSR3 | 0.64393 | 3 | 0 | 3 |
| TBC1D13 | MRPS6 | 0.617258 | 3 | 0 | 3 |
| TBC1D13 | DXO | 0.615346 | 4 | 0 | 4 |
| TBC1D13 | ZNF284 | 0.610155 | 3 | 0 | 3 |
| TBC1D13 | PTGIR | 0.603963 | 3 | 0 | 3 |
| TBC1D13 | SFRP4 | 0.603305 | 4 | 0 | 3 |
| TBC1D13 | GNA11 | 0.597195 | 4 | 0 | 3 |
| TBC1D13 | TFPT | 0.596484 | 5 | 0 | 3 |
| TBC1D13 | ZDHHC14 | 0.596274 | 4 | 0 | 3 |
| TBC1D13 | TBC1D2B | 0.590299 | 3 | 0 | 3 |
| TBC1D13 | EMC10 | 0.589628 | 4 | 0 | 3 |
| TBC1D13 | CAND2 | 0.589492 | 3 | 0 | 3 |
| TBC1D13 | ZRSR2 | 0.587691 | 4 | 0 | 3 |
| TBC1D13 | TGFBRAP1 | 0.586083 | 4 | 0 | 3 |
| TBC1D13 | USP27X | 0.585796 | 4 | 0 | 3 |
| TBC1D13 | SHC2 | 0.58448 | 3 | 0 | 3 |
| TBC1D13 | POFUT2 | 0.581744 | 4 | 0 | 3 |
For details and further investigation, click here