| Full name: TCF3 fusion partner | Alias Symbol: FB1|amida|INO80F | ||
| Type: protein-coding gene | Cytoband: 19q13.42 | ||
| Entrez ID: 29844 | HGNC ID: HGNC:13630 | Ensembl Gene: ENSG00000105619 | OMIM ID: 609519 |
Expression of TFPT:
| Dataset | Gene | EntrezID | Probe | Log2FC | Adj.pValue | Expression |
|---|---|---|---|---|---|---|
| GSE17351 | TFPT | 29844 | 218996_at | 0.5262 | 0.2147 | |
| GSE20347 | TFPT | 29844 | 218996_at | 0.2291 | 0.0988 | |
| GSE23400 | TFPT | 29844 | 218996_at | 0.1739 | 0.0051 | |
| GSE26886 | TFPT | 29844 | 218996_at | -0.0071 | 0.9693 | |
| GSE29001 | TFPT | 29844 | 218996_at | 0.3548 | 0.1795 | |
| GSE38129 | TFPT | 29844 | 218996_at | 0.2956 | 0.0962 | |
| GSE45670 | TFPT | 29844 | 218996_at | 0.2005 | 0.1040 | |
| GSE53622 | TFPT | 29844 | 18790 | -0.2082 | 0.0178 | |
| GSE53624 | TFPT | 29844 | 18790 | -0.0306 | 0.7870 | |
| GSE63941 | TFPT | 29844 | 218996_at | 0.1081 | 0.8657 | |
| GSE77861 | TFPT | 29844 | 218996_at | 0.0308 | 0.8699 | |
| GSE97050 | TFPT | 29844 | A_33_P3287039 | 0.0102 | 0.9717 | |
| SRP064894 | TFPT | 29844 | RNAseq | 1.0826 | 0.0086 | |
| SRP133303 | TFPT | 29844 | RNAseq | 0.1142 | 0.4118 | |
| SRP159526 | TFPT | 29844 | RNAseq | 0.6630 | 0.0447 | |
| SRP193095 | TFPT | 29844 | RNAseq | 0.5269 | 0.0012 | |
| SRP219564 | TFPT | 29844 | RNAseq | 0.1402 | 0.7436 | |
| TCGA | TFPT | 29844 | RNAseq | 0.0096 | 0.9022 |
Upregulated datasets: 1; Downregulated datasets: 0.
Survival by TFPT expression:
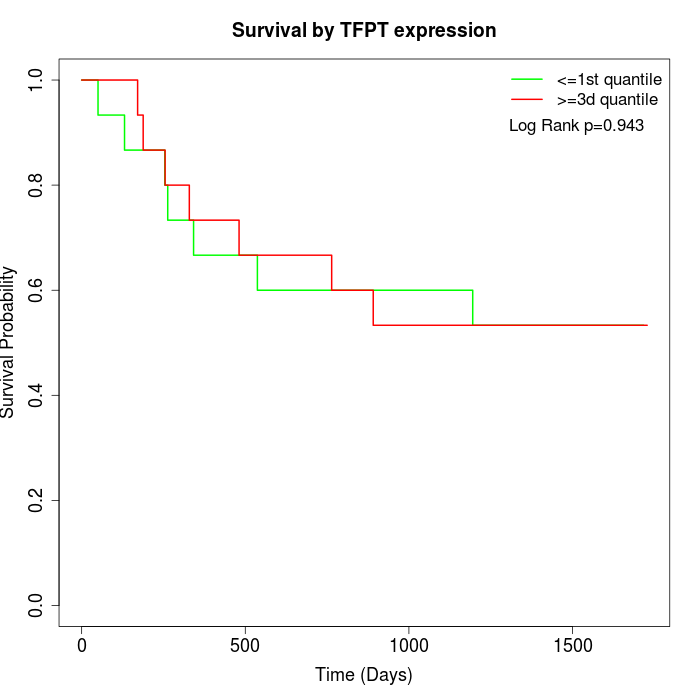 | 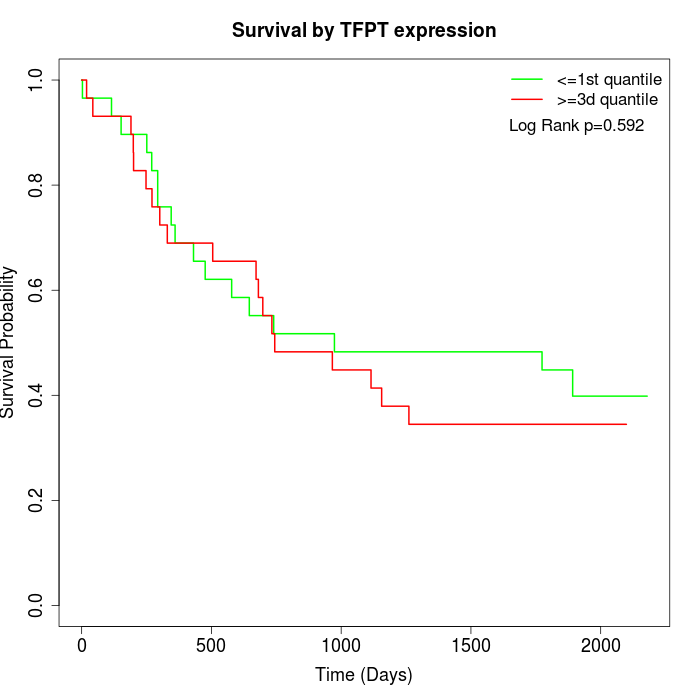 | 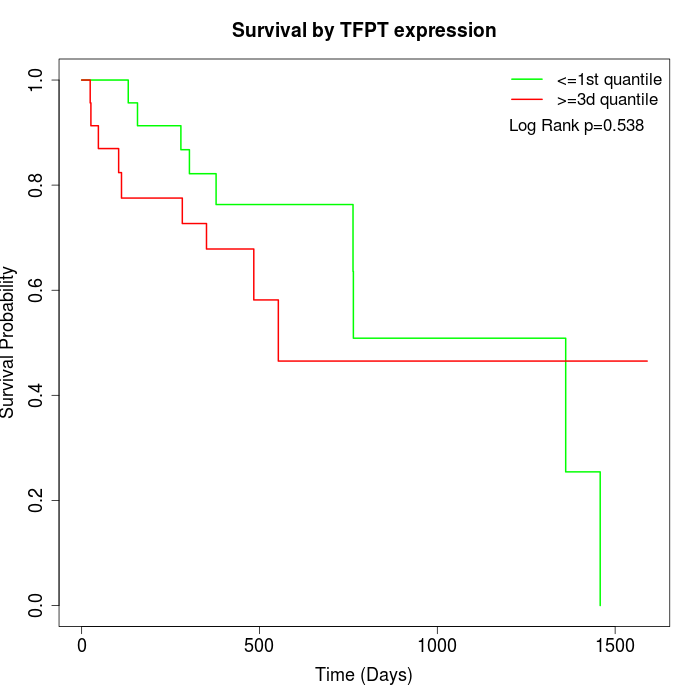 |
| GSE53622 | GSE53624 | TCGA |
Note: Click image to view full size file.
Copy number change of TFPT:
| Dataset | Gene | EntrezID | Gain | Loss | Normal | Detail |
|---|---|---|---|---|---|---|
| GSE15526 | TFPT | 29844 | 3 | 4 | 23 | |
| GSE20123 | TFPT | 29844 | 3 | 3 | 24 | |
| GSE43470 | TFPT | 29844 | 2 | 11 | 30 | |
| GSE46452 | TFPT | 29844 | 45 | 1 | 13 | |
| GSE47630 | TFPT | 29844 | 8 | 6 | 26 | |
| GSE54993 | TFPT | 29844 | 17 | 4 | 49 | |
| GSE54994 | TFPT | 29844 | 4 | 14 | 35 | |
| GSE60625 | TFPT | 29844 | 9 | 0 | 2 | |
| GSE74703 | TFPT | 29844 | 2 | 7 | 27 | |
| GSE74704 | TFPT | 29844 | 3 | 1 | 16 | |
| TCGA | TFPT | 29844 | 19 | 15 | 62 |
Total number of gains: 115; Total number of losses: 66; Total Number of normals: 307.
Somatic mutations of TFPT:
Generating mutation plots.
Highly correlated genes for TFPT:
Showing top 20/255 corelated genes with mean PCC>0.5.
| Gene1 | Gene2 | Mean PCC | Num. Datasets | Num. PCC<0 | Num. PCC>0.5 |
|---|---|---|---|---|---|
| TFPT | ANXA5 | 0.682385 | 3 | 0 | 3 |
| TFPT | CHCHD6 | 0.677189 | 3 | 0 | 3 |
| TFPT | DTNBP1 | 0.670378 | 3 | 0 | 3 |
| TFPT | HNRNPAB | 0.66598 | 3 | 0 | 3 |
| TFPT | RAD1 | 0.660699 | 3 | 0 | 3 |
| TFPT | DYRK2 | 0.660097 | 4 | 0 | 3 |
| TFPT | KBTBD8 | 0.656729 | 3 | 0 | 3 |
| TFPT | PANK4 | 0.644085 | 4 | 0 | 3 |
| TFPT | HSP90B1 | 0.638208 | 3 | 0 | 3 |
| TFPT | COA7 | 0.633527 | 3 | 0 | 3 |
| TFPT | SLC39A7 | 0.6334 | 7 | 0 | 6 |
| TFPT | CAMTA1 | 0.626929 | 3 | 0 | 3 |
| TFPT | PSAP | 0.622595 | 7 | 0 | 6 |
| TFPT | C8orf33 | 0.621651 | 4 | 0 | 4 |
| TFPT | CTU2 | 0.619978 | 3 | 0 | 3 |
| TFPT | ZNF227 | 0.619373 | 6 | 0 | 5 |
| TFPT | LRRC47 | 0.617707 | 4 | 0 | 4 |
| TFPT | SFRP4 | 0.613498 | 3 | 0 | 3 |
| TFPT | SSPN | 0.612968 | 4 | 0 | 3 |
| TFPT | GYS1 | 0.612109 | 5 | 0 | 4 |
For details and further investigation, click here