| Full name: TBC1 domain family member 2 | Alias Symbol: PARIS1|TBC1D2A|Armus | ||
| Type: protein-coding gene | Cytoband: 9q22.33 | ||
| Entrez ID: 55357 | HGNC ID: HGNC:18026 | Ensembl Gene: ENSG00000095383 | OMIM ID: 609871 |
Expression of TBC1D2:
| Dataset | Gene | EntrezID | Probe | Log2FC | Adj.pValue | Expression |
|---|---|---|---|---|---|---|
| GSE17351 | TBC1D2 | 55357 | 222173_s_at | -0.1028 | 0.9300 | |
| GSE20347 | TBC1D2 | 55357 | 222173_s_at | -0.3976 | 0.0550 | |
| GSE23400 | TBC1D2 | 55357 | 222173_s_at | 0.0949 | 0.3255 | |
| GSE26886 | TBC1D2 | 55357 | 222173_s_at | -0.0186 | 0.9374 | |
| GSE29001 | TBC1D2 | 55357 | 222173_s_at | 0.0429 | 0.9088 | |
| GSE38129 | TBC1D2 | 55357 | 222173_s_at | 0.2083 | 0.4954 | |
| GSE45670 | TBC1D2 | 55357 | 222173_s_at | 0.4104 | 0.0148 | |
| GSE53622 | TBC1D2 | 55357 | 39529 | -0.1637 | 0.3854 | |
| GSE53624 | TBC1D2 | 55357 | 39529 | -0.0350 | 0.7485 | |
| GSE63941 | TBC1D2 | 55357 | 222173_s_at | 1.0258 | 0.1947 | |
| GSE77861 | TBC1D2 | 55357 | 222173_s_at | 0.1402 | 0.6669 | |
| GSE97050 | TBC1D2 | 55357 | A_33_P3216292 | 0.6474 | 0.3715 | |
| SRP007169 | TBC1D2 | 55357 | RNAseq | 0.1394 | 0.8071 | |
| SRP008496 | TBC1D2 | 55357 | RNAseq | -0.0869 | 0.8109 | |
| SRP064894 | TBC1D2 | 55357 | RNAseq | 0.3883 | 0.1119 | |
| SRP133303 | TBC1D2 | 55357 | RNAseq | 0.3471 | 0.2328 | |
| SRP159526 | TBC1D2 | 55357 | RNAseq | -0.5681 | 0.1531 | |
| SRP193095 | TBC1D2 | 55357 | RNAseq | 0.2302 | 0.3552 | |
| SRP219564 | TBC1D2 | 55357 | RNAseq | 0.0200 | 0.9751 | |
| TCGA | TBC1D2 | 55357 | RNAseq | 0.4501 | 0.0000 |
Upregulated datasets: 0; Downregulated datasets: 0.
Survival by TBC1D2 expression:
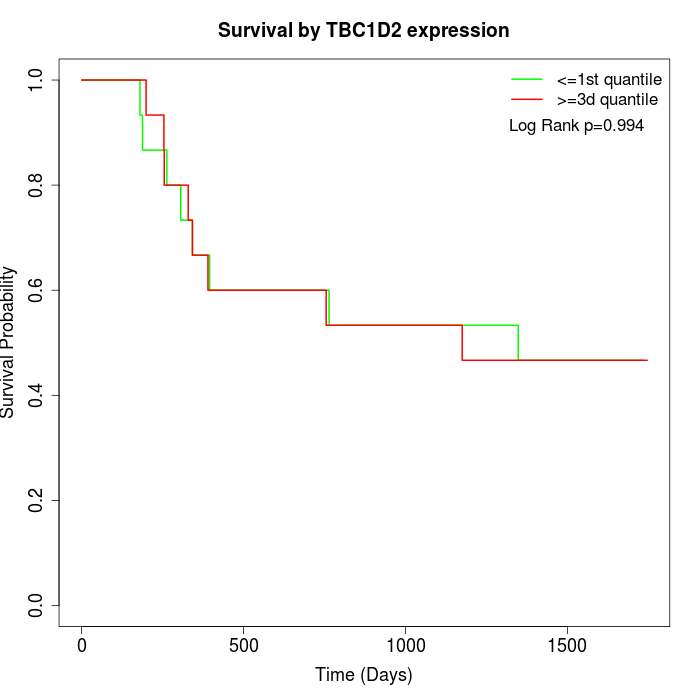 | 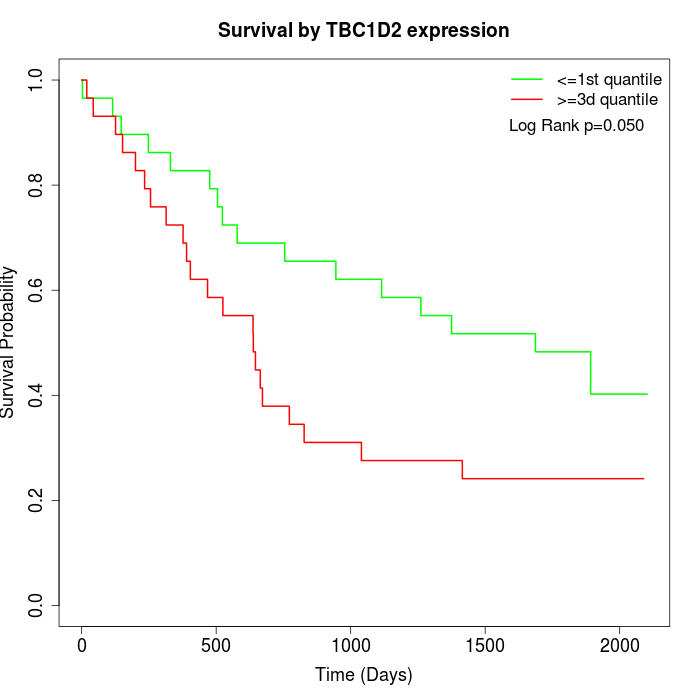 | 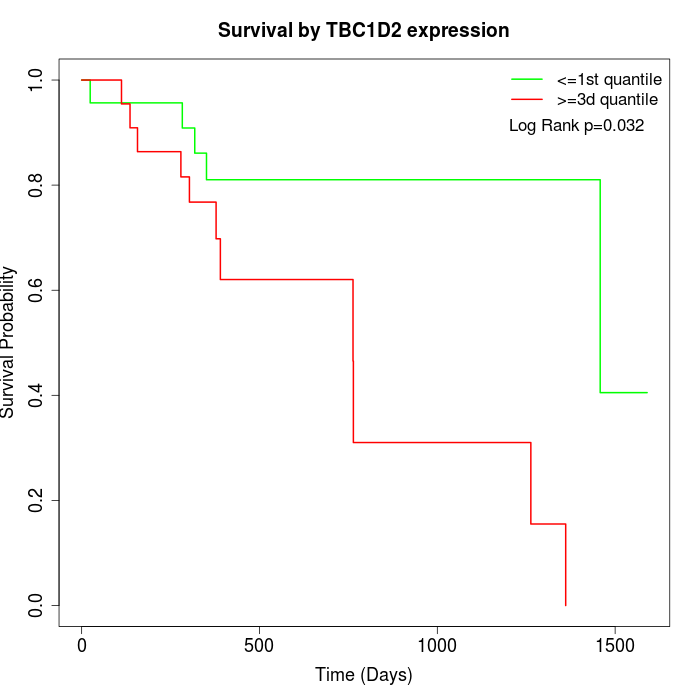 |
| GSE53622 | GSE53624 | TCGA |
Note: Click image to view full size file.
Copy number change of TBC1D2:
| Dataset | Gene | EntrezID | Gain | Loss | Normal | Detail |
|---|---|---|---|---|---|---|
| GSE15526 | TBC1D2 | 55357 | 4 | 9 | 17 | |
| GSE20123 | TBC1D2 | 55357 | 5 | 8 | 17 | |
| GSE43470 | TBC1D2 | 55357 | 6 | 3 | 34 | |
| GSE46452 | TBC1D2 | 55357 | 6 | 14 | 39 | |
| GSE47630 | TBC1D2 | 55357 | 1 | 17 | 22 | |
| GSE54993 | TBC1D2 | 55357 | 3 | 3 | 64 | |
| GSE54994 | TBC1D2 | 55357 | 8 | 11 | 34 | |
| GSE60625 | TBC1D2 | 55357 | 0 | 0 | 11 | |
| GSE74703 | TBC1D2 | 55357 | 5 | 3 | 28 | |
| GSE74704 | TBC1D2 | 55357 | 3 | 5 | 12 | |
| TCGA | TBC1D2 | 55357 | 27 | 22 | 47 |
Total number of gains: 68; Total number of losses: 95; Total Number of normals: 325.
Somatic mutations of TBC1D2:
Generating mutation plots.
Highly correlated genes for TBC1D2:
Showing top 20/512 corelated genes with mean PCC>0.5.
| Gene1 | Gene2 | Mean PCC | Num. Datasets | Num. PCC<0 | Num. PCC>0.5 |
|---|---|---|---|---|---|
| TBC1D2 | MFN1 | 0.774171 | 3 | 0 | 3 |
| TBC1D2 | ATP11B | 0.762738 | 3 | 0 | 3 |
| TBC1D2 | CDK5RAP2 | 0.761882 | 3 | 0 | 3 |
| TBC1D2 | SLC30A6 | 0.748008 | 3 | 0 | 3 |
| TBC1D2 | SLC25A43 | 0.733044 | 3 | 0 | 3 |
| TBC1D2 | SNRPA1 | 0.730468 | 3 | 0 | 3 |
| TBC1D2 | MREG | 0.725537 | 5 | 0 | 4 |
| TBC1D2 | FOPNL | 0.719292 | 3 | 0 | 3 |
| TBC1D2 | C12orf66 | 0.715663 | 3 | 0 | 3 |
| TBC1D2 | SREBF2 | 0.713603 | 3 | 0 | 3 |
| TBC1D2 | RAC2 | 0.712898 | 3 | 0 | 3 |
| TBC1D2 | CTSH | 0.711943 | 3 | 0 | 3 |
| TBC1D2 | FAM49B | 0.708713 | 3 | 0 | 3 |
| TBC1D2 | SLC50A1 | 0.706981 | 4 | 0 | 3 |
| TBC1D2 | RIPK3 | 0.705952 | 3 | 0 | 3 |
| TBC1D2 | CNOT1 | 0.69687 | 3 | 0 | 3 |
| TBC1D2 | TTF2 | 0.695633 | 4 | 0 | 4 |
| TBC1D2 | EFHD2 | 0.694776 | 3 | 0 | 3 |
| TBC1D2 | PPP1CA | 0.694386 | 4 | 0 | 4 |
| TBC1D2 | FBXO39 | 0.691508 | 3 | 0 | 3 |
For details and further investigation, click here