| Full name: TBC1 domain family member 30 | Alias Symbol: KIAA0984 | ||
| Type: protein-coding gene | Cytoband: 12q14.3 | ||
| Entrez ID: 23329 | HGNC ID: HGNC:29164 | Ensembl Gene: ENSG00000111490 | OMIM ID: 615077 |
| Drug and gene relationship at DGIdb | |||
Expression of TBC1D30:
| Dataset | Gene | EntrezID | Probe | Log2FC | Adj.pValue | Expression |
|---|---|---|---|---|---|---|
| GSE17351 | TBC1D30 | 23329 | 215186_at | -0.0721 | 0.7514 | |
| GSE20347 | TBC1D30 | 23329 | 215186_at | -0.0444 | 0.6670 | |
| GSE23400 | TBC1D30 | 23329 | 213912_at | -0.0074 | 0.8396 | |
| GSE26886 | TBC1D30 | 23329 | 213912_at | 0.8787 | 0.0022 | |
| GSE29001 | TBC1D30 | 23329 | 213912_at | 0.0567 | 0.7340 | |
| GSE38129 | TBC1D30 | 23329 | 213912_at | 0.2607 | 0.0364 | |
| GSE45670 | TBC1D30 | 23329 | 215186_at | 0.0927 | 0.2958 | |
| GSE53622 | TBC1D30 | 23329 | 33055 | 0.5489 | 0.0007 | |
| GSE53624 | TBC1D30 | 23329 | 134750 | 0.2611 | 0.0122 | |
| GSE63941 | TBC1D30 | 23329 | 213913_s_at | 1.4620 | 0.0695 | |
| GSE77861 | TBC1D30 | 23329 | 215186_at | -0.1876 | 0.0755 | |
| GSE97050 | TBC1D30 | 23329 | A_32_P206050 | 0.1622 | 0.4399 | |
| SRP007169 | TBC1D30 | 23329 | RNAseq | 3.0249 | 0.0003 | |
| SRP064894 | TBC1D30 | 23329 | RNAseq | 0.7993 | 0.0267 | |
| SRP133303 | TBC1D30 | 23329 | RNAseq | 1.1842 | 0.0040 | |
| SRP159526 | TBC1D30 | 23329 | RNAseq | 1.7596 | 0.0000 | |
| SRP193095 | TBC1D30 | 23329 | RNAseq | 0.8316 | 0.0168 | |
| SRP219564 | TBC1D30 | 23329 | RNAseq | 2.6912 | 0.0000 |
Upregulated datasets: 4; Downregulated datasets: 0.
Survival by TBC1D30 expression:
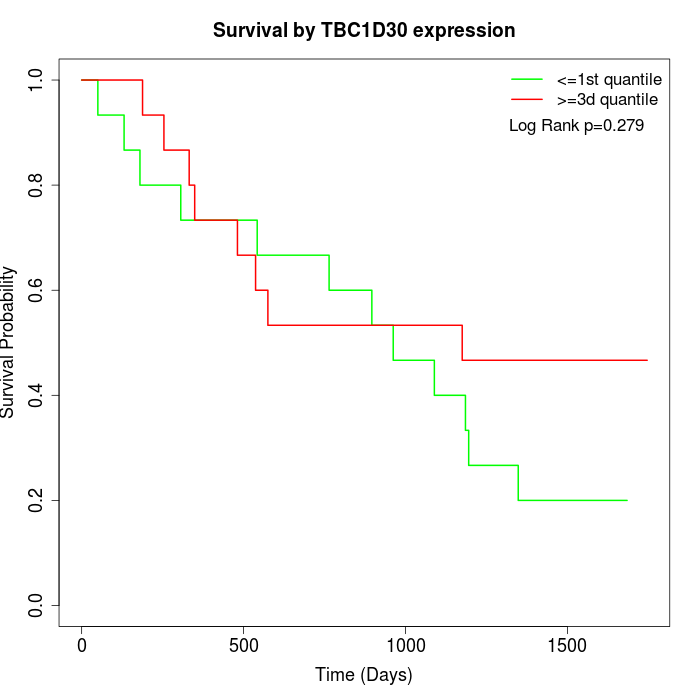 | 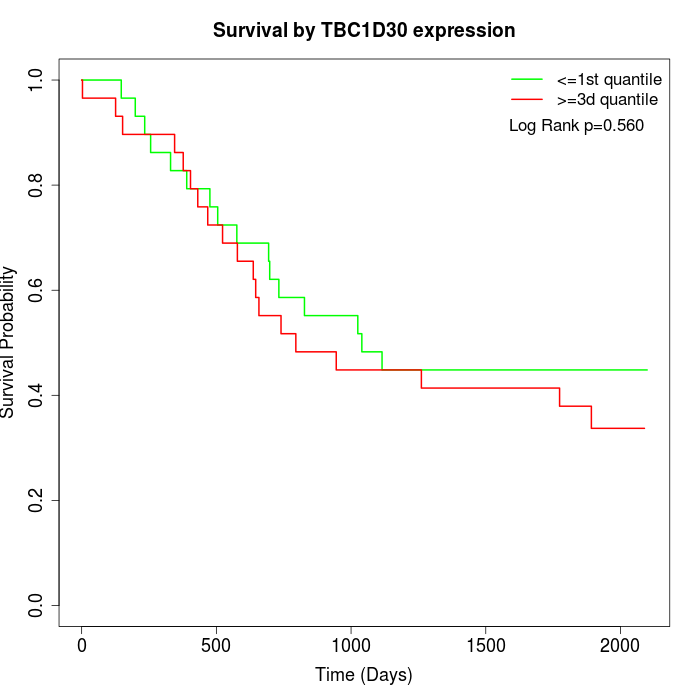 |
| GSE53622 | GSE53624 |
Note: Click image to view full size file.
Copy number change of TBC1D30:
| Dataset | Gene | EntrezID | Gain | Loss | Normal | Detail |
|---|---|---|---|---|---|---|
| GSE15526 | TBC1D30 | 23329 | 5 | 2 | 23 | |
| GSE20123 | TBC1D30 | 23329 | 5 | 1 | 24 | |
| GSE43470 | TBC1D30 | 23329 | 5 | 0 | 38 | |
| GSE46452 | TBC1D30 | 23329 | 11 | 0 | 48 | |
| GSE47630 | TBC1D30 | 23329 | 10 | 2 | 28 | |
| GSE54993 | TBC1D30 | 23329 | 0 | 6 | 64 | |
| GSE54994 | TBC1D30 | 23329 | 7 | 1 | 45 | |
| GSE60625 | TBC1D30 | 23329 | 0 | 0 | 11 | |
| GSE74703 | TBC1D30 | 23329 | 5 | 0 | 31 | |
| GSE74704 | TBC1D30 | 23329 | 4 | 1 | 15 | |
| TCGA | TBC1D30 | 23329 | 21 | 9 | 66 |
Total number of gains: 73; Total number of losses: 22; Total Number of normals: 393.
Somatic mutations of TBC1D30:
Generating mutation plots.
Highly correlated genes for TBC1D30:
Showing top 20/33 corelated genes with mean PCC>0.5.
| Gene1 | Gene2 | Mean PCC | Num. Datasets | Num. PCC<0 | Num. PCC>0.5 |
|---|---|---|---|---|---|
| TBC1D30 | STAP2 | 0.659364 | 4 | 0 | 4 |
| TBC1D30 | LYPLA1 | 0.644855 | 3 | 0 | 3 |
| TBC1D30 | KIAA1217 | 0.612485 | 4 | 0 | 3 |
| TBC1D30 | NEBL | 0.610313 | 4 | 0 | 3 |
| TBC1D30 | KRT76 | 0.599263 | 4 | 0 | 4 |
| TBC1D30 | SLC27A2 | 0.597261 | 4 | 0 | 3 |
| TBC1D30 | SPINT1 | 0.593013 | 3 | 0 | 3 |
| TBC1D30 | ZNF280A | 0.591428 | 3 | 0 | 3 |
| TBC1D30 | GRHL2 | 0.584944 | 3 | 0 | 3 |
| TBC1D30 | NEUROD2 | 0.575642 | 4 | 0 | 3 |
| TBC1D30 | ACRV1 | 0.570346 | 4 | 0 | 3 |
| TBC1D30 | TMEM182 | 0.560352 | 4 | 0 | 3 |
| TBC1D30 | DNAH2 | 0.558799 | 5 | 0 | 4 |
| TBC1D30 | TECR | 0.558569 | 4 | 0 | 3 |
| TBC1D30 | CDH8 | 0.555556 | 4 | 0 | 3 |
| TBC1D30 | SYNGR4 | 0.551748 | 6 | 0 | 3 |
| TBC1D30 | PPP1R17 | 0.546599 | 4 | 0 | 3 |
| TBC1D30 | HPX | 0.541049 | 5 | 0 | 3 |
| TBC1D30 | UMOD | 0.540628 | 4 | 0 | 3 |
| TBC1D30 | OR7C1 | 0.540569 | 4 | 0 | 3 |
For details and further investigation, click here