| Full name: tubulin folding cofactor E | Alias Symbol: KCS1|pac2 | ||
| Type: protein-coding gene | Cytoband: 1q42.3 | ||
| Entrez ID: 6905 | HGNC ID: HGNC:11582 | Ensembl Gene: ENSG00000284770 | OMIM ID: 604934 |
Expression of TBCE:
| Dataset | Gene | EntrezID | Probe | Log2FC | Adj.pValue | Expression |
|---|---|---|---|---|---|---|
| GSE17351 | TBCE | 6905 | 203714_s_at | 0.5586 | 0.1694 | |
| GSE20347 | TBCE | 6905 | 203714_s_at | 0.4740 | 0.0002 | |
| GSE23400 | TBCE | 6905 | 203714_s_at | 0.4162 | 0.0000 | |
| GSE26886 | TBCE | 6905 | 203714_s_at | 1.0174 | 0.0000 | |
| GSE29001 | TBCE | 6905 | 203714_s_at | 0.3384 | 0.0744 | |
| GSE38129 | TBCE | 6905 | 203714_s_at | 0.6363 | 0.0000 | |
| GSE45670 | TBCE | 6905 | 203714_s_at | 0.2081 | 0.1199 | |
| GSE63941 | TBCE | 6905 | 203714_s_at | 0.5568 | 0.2475 | |
| GSE77861 | TBCE | 6905 | 203714_s_at | 0.6145 | 0.0068 | |
| GSE97050 | TBCE | 6905 | A_23_P52147 | -0.3913 | 0.2401 | |
| SRP007169 | TBCE | 6905 | RNAseq | -0.0043 | 0.9913 | |
| SRP008496 | TBCE | 6905 | RNAseq | -0.0251 | 0.9285 | |
| SRP064894 | TBCE | 6905 | RNAseq | 0.3617 | 0.0382 | |
| SRP133303 | TBCE | 6905 | RNAseq | 0.4479 | 0.0006 | |
| SRP159526 | TBCE | 6905 | RNAseq | 0.3694 | 0.3130 | |
| SRP193095 | TBCE | 6905 | RNAseq | 0.1892 | 0.0110 | |
| SRP219564 | TBCE | 6905 | RNAseq | 0.6907 | 0.1047 | |
| TCGA | TBCE | 6905 | RNAseq | 0.3078 | 0.0000 |
Upregulated datasets: 1; Downregulated datasets: 0.
Survival by TBCE expression:
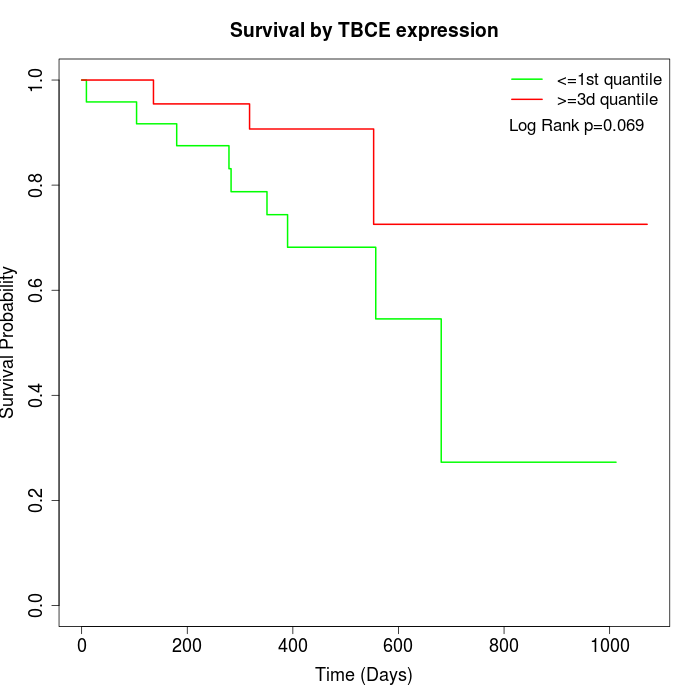 |
| TCGA |
Note: Click image to view full size file.
Copy number change of TBCE:
| Dataset | Gene | EntrezID | Gain | Loss | Normal | Detail |
|---|---|---|---|---|---|---|
| GSE15526 | TBCE | 6905 | 10 | 0 | 20 | |
| GSE20123 | TBCE | 6905 | 11 | 0 | 19 | |
| GSE43470 | TBCE | 6905 | 8 | 1 | 34 | |
| GSE46452 | TBCE | 6905 | 4 | 2 | 53 | |
| GSE47630 | TBCE | 6905 | 15 | 0 | 25 | |
| GSE54993 | TBCE | 6905 | 0 | 6 | 64 | |
| GSE54994 | TBCE | 6905 | 16 | 0 | 37 | |
| GSE60625 | TBCE | 6905 | 0 | 0 | 11 | |
| GSE74703 | TBCE | 6905 | 8 | 1 | 27 | |
| GSE74704 | TBCE | 6905 | 5 | 0 | 15 | |
| TCGA | TBCE | 6905 | 44 | 3 | 49 |
Total number of gains: 121; Total number of losses: 13; Total Number of normals: 354.
Somatic mutations of TBCE:
Generating mutation plots.
Highly correlated genes for TBCE:
Showing top 20/1096 corelated genes with mean PCC>0.5.
| Gene1 | Gene2 | Mean PCC | Num. Datasets | Num. PCC<0 | Num. PCC>0.5 |
|---|---|---|---|---|---|
| TBCE | HEATR1 | 0.7484 | 10 | 0 | 9 |
| TBCE | TOP1MT | 0.743302 | 4 | 0 | 4 |
| TBCE | PSMG3 | 0.740852 | 3 | 0 | 3 |
| TBCE | FMNL2 | 0.730375 | 4 | 0 | 4 |
| TBCE | SHISA2 | 0.721371 | 3 | 0 | 3 |
| TBCE | C14orf119 | 0.719429 | 3 | 0 | 3 |
| TBCE | SCYL1 | 0.714909 | 4 | 0 | 4 |
| TBCE | COA6 | 0.714851 | 5 | 0 | 5 |
| TBCE | IL31RA | 0.702311 | 4 | 0 | 4 |
| TBCE | CEP95 | 0.702294 | 3 | 0 | 3 |
| TBCE | MTERF3 | 0.698583 | 8 | 0 | 8 |
| TBCE | KPNA2 | 0.698143 | 7 | 0 | 6 |
| TBCE | DDX55 | 0.687495 | 4 | 0 | 4 |
| TBCE | CCNB1 | 0.685105 | 7 | 0 | 7 |
| TBCE | RRP15 | 0.683977 | 10 | 0 | 9 |
| TBCE | DESI2 | 0.68203 | 8 | 0 | 8 |
| TBCE | TOP2A | 0.681113 | 8 | 0 | 7 |
| TBCE | ITGA3 | 0.680473 | 5 | 0 | 4 |
| TBCE | ASPM | 0.679797 | 9 | 0 | 9 |
| TBCE | C1orf131 | 0.67834 | 7 | 0 | 6 |
For details and further investigation, click here