| Full name: transmembrane protein 30B | Alias Symbol: CDC50B | ||
| Type: protein-coding gene | Cytoband: 14q23.1 | ||
| Entrez ID: 161291 | HGNC ID: HGNC:27254 | Ensembl Gene: ENSG00000182107 | OMIM ID: 611029 |
Expression of TMEM30B:
| Dataset | Gene | EntrezID | Probe | Log2FC | Adj.pValue | Expression |
|---|---|---|---|---|---|---|
| GSE17351 | TMEM30B | 161291 | 213285_at | 0.1389 | 0.8595 | |
| GSE20347 | TMEM30B | 161291 | 213285_at | -0.4052 | 0.0232 | |
| GSE23400 | TMEM30B | 161291 | 213285_at | 0.2676 | 0.0565 | |
| GSE26886 | TMEM30B | 161291 | 213285_at | -0.3335 | 0.3423 | |
| GSE29001 | TMEM30B | 161291 | 213285_at | -0.1291 | 0.8313 | |
| GSE38129 | TMEM30B | 161291 | 213285_at | 0.2058 | 0.4977 | |
| GSE45670 | TMEM30B | 161291 | 213285_at | 0.0701 | 0.7861 | |
| GSE53622 | TMEM30B | 161291 | 60645 | 0.1420 | 0.4523 | |
| GSE53624 | TMEM30B | 161291 | 60645 | -0.3057 | 0.0129 | |
| GSE63941 | TMEM30B | 161291 | 213285_at | 4.4850 | 0.0031 | |
| GSE77861 | TMEM30B | 161291 | 213285_at | -0.0176 | 0.9633 | |
| GSE97050 | TMEM30B | 161291 | A_32_P129752 | 0.4584 | 0.3618 | |
| SRP007169 | TMEM30B | 161291 | RNAseq | -0.4385 | 0.2307 | |
| SRP008496 | TMEM30B | 161291 | RNAseq | -0.3571 | 0.1211 | |
| SRP064894 | TMEM30B | 161291 | RNAseq | 0.0338 | 0.9056 | |
| SRP133303 | TMEM30B | 161291 | RNAseq | -0.0305 | 0.9101 | |
| SRP159526 | TMEM30B | 161291 | RNAseq | -0.1756 | 0.4702 | |
| SRP193095 | TMEM30B | 161291 | RNAseq | -0.5690 | 0.0017 | |
| SRP219564 | TMEM30B | 161291 | RNAseq | 0.1289 | 0.8596 | |
| TCGA | TMEM30B | 161291 | RNAseq | -0.1342 | 0.2474 |
Upregulated datasets: 1; Downregulated datasets: 0.
Survival by TMEM30B expression:
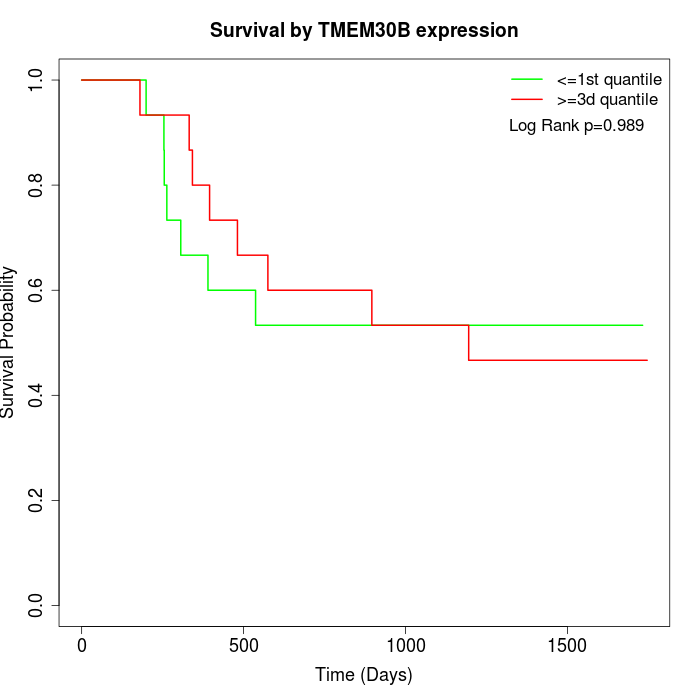 | 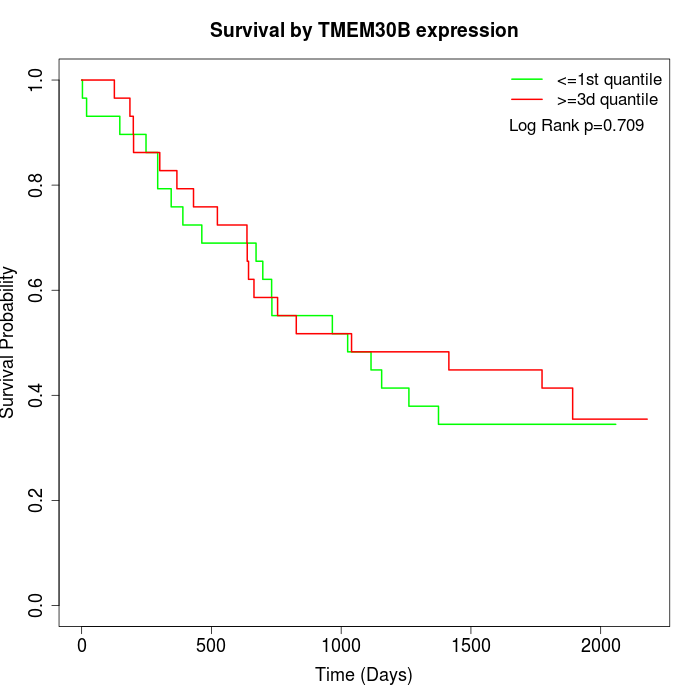 | 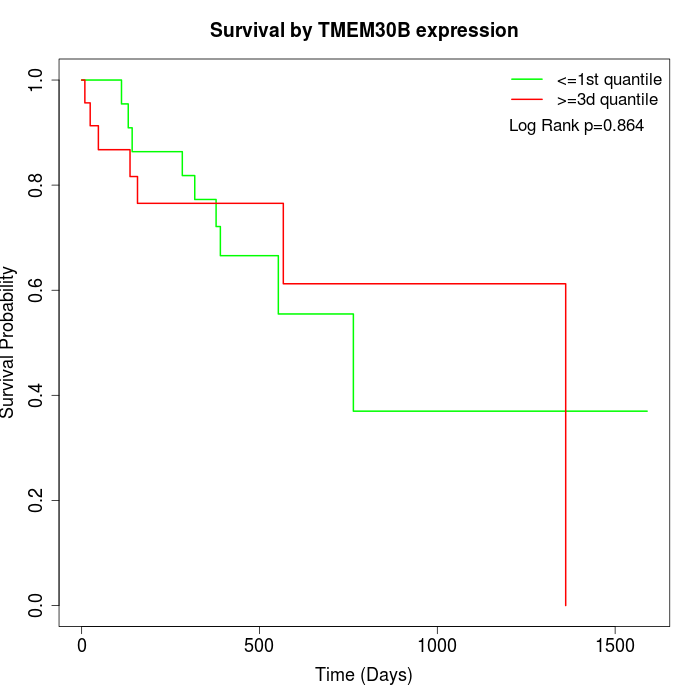 |
| GSE53622 | GSE53624 | TCGA |
Note: Click image to view full size file.
Copy number change of TMEM30B:
| Dataset | Gene | EntrezID | Gain | Loss | Normal | Detail |
|---|---|---|---|---|---|---|
| GSE15526 | TMEM30B | 161291 | 9 | 3 | 18 | |
| GSE20123 | TMEM30B | 161291 | 9 | 3 | 18 | |
| GSE43470 | TMEM30B | 161291 | 8 | 2 | 33 | |
| GSE46452 | TMEM30B | 161291 | 16 | 3 | 40 | |
| GSE47630 | TMEM30B | 161291 | 11 | 9 | 20 | |
| GSE54993 | TMEM30B | 161291 | 3 | 9 | 58 | |
| GSE54994 | TMEM30B | 161291 | 19 | 4 | 30 | |
| GSE60625 | TMEM30B | 161291 | 0 | 2 | 9 | |
| GSE74703 | TMEM30B | 161291 | 7 | 2 | 27 | |
| GSE74704 | TMEM30B | 161291 | 4 | 2 | 14 | |
| TCGA | TMEM30B | 161291 | 33 | 14 | 49 |
Total number of gains: 119; Total number of losses: 53; Total Number of normals: 316.
Somatic mutations of TMEM30B:
Generating mutation plots.
Highly correlated genes for TMEM30B:
Showing top 20/571 corelated genes with mean PCC>0.5.
| Gene1 | Gene2 | Mean PCC | Num. Datasets | Num. PCC<0 | Num. PCC>0.5 |
|---|---|---|---|---|---|
| TMEM30B | COMMD2 | 0.725093 | 4 | 0 | 4 |
| TMEM30B | SAMD12 | 0.718841 | 3 | 0 | 3 |
| TMEM30B | SH2D3A | 0.712942 | 6 | 0 | 5 |
| TMEM30B | STARD10 | 0.707192 | 4 | 0 | 3 |
| TMEM30B | ZDHHC12 | 0.706189 | 3 | 0 | 3 |
| TMEM30B | KDM2B | 0.699623 | 3 | 0 | 3 |
| TMEM30B | E2F2 | 0.695178 | 5 | 0 | 4 |
| TMEM30B | HELQ | 0.691151 | 3 | 0 | 3 |
| TMEM30B | STON2 | 0.686344 | 4 | 0 | 3 |
| TMEM30B | GALNT3 | 0.681996 | 9 | 0 | 7 |
| TMEM30B | TYSND1 | 0.681832 | 4 | 0 | 4 |
| TMEM30B | SYT17 | 0.675029 | 3 | 0 | 3 |
| TMEM30B | KIF21A | 0.674901 | 3 | 0 | 3 |
| TMEM30B | PHF6 | 0.674516 | 3 | 0 | 3 |
| TMEM30B | RNF144B | 0.674298 | 4 | 0 | 4 |
| TMEM30B | RAB25 | 0.672681 | 6 | 0 | 5 |
| TMEM30B | MRPL38 | 0.671804 | 3 | 0 | 3 |
| TMEM30B | IRX3 | 0.67086 | 4 | 0 | 3 |
| TMEM30B | F2RL1 | 0.66949 | 4 | 0 | 3 |
| TMEM30B | GTF3C4 | 0.669316 | 3 | 0 | 3 |
For details and further investigation, click here