| Full name: TNFAIP3 interacting protein 1 | Alias Symbol: NAF1|KIAA0113|ABIN-1|VAN | ||
| Type: protein-coding gene | Cytoband: 5q33.1 | ||
| Entrez ID: 10318 | HGNC ID: HGNC:16903 | Ensembl Gene: ENSG00000145901 | OMIM ID: 607714 |
Expression of TNIP1:
| Dataset | Gene | EntrezID | Probe | Log2FC | Adj.pValue | Expression |
|---|---|---|---|---|---|---|
| GSE17351 | TNIP1 | 10318 | 207196_s_at | -0.2762 | 0.6433 | |
| GSE20347 | TNIP1 | 10318 | 207196_s_at | -0.8951 | 0.0000 | |
| GSE23400 | TNIP1 | 10318 | 207196_s_at | -0.6043 | 0.0000 | |
| GSE26886 | TNIP1 | 10318 | 207196_s_at | -0.7327 | 0.0054 | |
| GSE29001 | TNIP1 | 10318 | 207196_s_at | -1.0738 | 0.0009 | |
| GSE38129 | TNIP1 | 10318 | 207196_s_at | -0.6599 | 0.0000 | |
| GSE45670 | TNIP1 | 10318 | 207196_s_at | -0.2811 | 0.0538 | |
| GSE53622 | TNIP1 | 10318 | 65334 | -0.7183 | 0.0000 | |
| GSE53624 | TNIP1 | 10318 | 65485 | -0.7170 | 0.0000 | |
| GSE63941 | TNIP1 | 10318 | 207196_s_at | -0.0212 | 0.9765 | |
| GSE77861 | TNIP1 | 10318 | 207196_s_at | -0.4909 | 0.0246 | |
| GSE97050 | TNIP1 | 10318 | A_23_P30435 | -0.0113 | 0.9728 | |
| SRP007169 | TNIP1 | 10318 | RNAseq | -1.4255 | 0.0302 | |
| SRP008496 | TNIP1 | 10318 | RNAseq | -1.6844 | 0.0000 | |
| SRP064894 | TNIP1 | 10318 | RNAseq | -1.0978 | 0.0000 | |
| SRP133303 | TNIP1 | 10318 | RNAseq | -0.4697 | 0.0267 | |
| SRP159526 | TNIP1 | 10318 | RNAseq | -0.7463 | 0.0129 | |
| SRP193095 | TNIP1 | 10318 | RNAseq | -0.7818 | 0.0000 | |
| SRP219564 | TNIP1 | 10318 | RNAseq | -0.5804 | 0.1167 | |
| TCGA | TNIP1 | 10318 | RNAseq | -0.0578 | 0.2093 |
Upregulated datasets: 0; Downregulated datasets: 4.
Survival by TNIP1 expression:
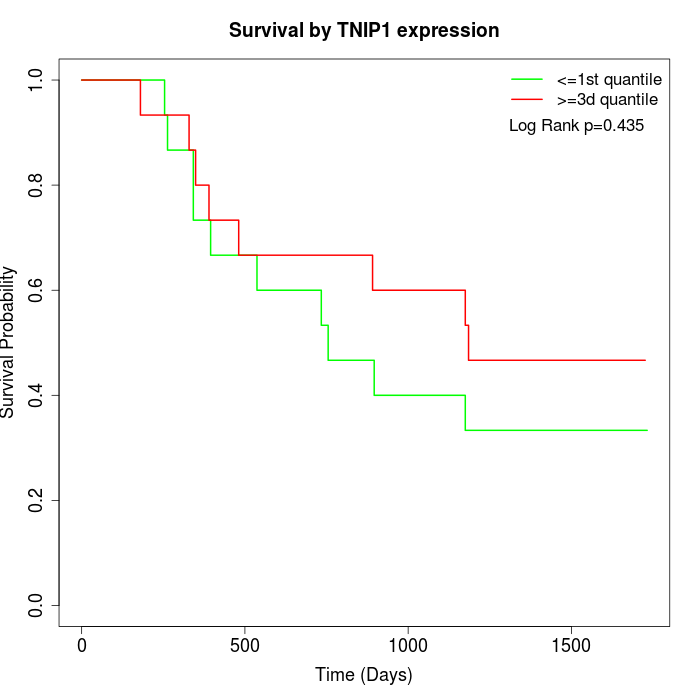 |  |  |
| GSE53622 | GSE53624 | TCGA |
Note: Click image to view full size file.
Copy number change of TNIP1:
| Dataset | Gene | EntrezID | Gain | Loss | Normal | Detail |
|---|---|---|---|---|---|---|
| GSE15526 | TNIP1 | 10318 | 1 | 12 | 17 | |
| GSE20123 | TNIP1 | 10318 | 1 | 12 | 17 | |
| GSE43470 | TNIP1 | 10318 | 1 | 11 | 31 | |
| GSE46452 | TNIP1 | 10318 | 0 | 27 | 32 | |
| GSE47630 | TNIP1 | 10318 | 0 | 20 | 20 | |
| GSE54993 | TNIP1 | 10318 | 9 | 1 | 60 | |
| GSE54994 | TNIP1 | 10318 | 2 | 15 | 36 | |
| GSE60625 | TNIP1 | 10318 | 0 | 0 | 11 | |
| GSE74703 | TNIP1 | 10318 | 1 | 8 | 27 | |
| GSE74704 | TNIP1 | 10318 | 1 | 7 | 12 | |
| TCGA | TNIP1 | 10318 | 5 | 37 | 54 |
Total number of gains: 21; Total number of losses: 150; Total Number of normals: 317.
Somatic mutations of TNIP1:
Generating mutation plots.
Highly correlated genes for TNIP1:
Showing top 20/1403 corelated genes with mean PCC>0.5.
| Gene1 | Gene2 | Mean PCC | Num. Datasets | Num. PCC<0 | Num. PCC>0.5 |
|---|---|---|---|---|---|
| TNIP1 | MLKL | 0.785043 | 3 | 0 | 3 |
| TNIP1 | DDI2 | 0.748241 | 3 | 0 | 3 |
| TNIP1 | TOM1L1 | 0.746627 | 3 | 0 | 3 |
| TNIP1 | BRWD3 | 0.744281 | 3 | 0 | 3 |
| TNIP1 | ZMYM2 | 0.736678 | 3 | 0 | 3 |
| TNIP1 | CCDC12 | 0.729721 | 4 | 0 | 4 |
| TNIP1 | MXD1 | 0.72892 | 10 | 0 | 10 |
| TNIP1 | FBXW11 | 0.728228 | 11 | 0 | 10 |
| TNIP1 | SH3GL1 | 0.727558 | 11 | 0 | 11 |
| TNIP1 | TOM1 | 0.723205 | 12 | 0 | 12 |
| TNIP1 | GPR108 | 0.722727 | 3 | 0 | 3 |
| TNIP1 | SESN2 | 0.720045 | 7 | 0 | 6 |
| TNIP1 | GGA3 | 0.718975 | 4 | 0 | 4 |
| TNIP1 | GRPEL2 | 0.716972 | 7 | 0 | 6 |
| TNIP1 | METRNL | 0.715752 | 7 | 0 | 6 |
| TNIP1 | SH3GLB1 | 0.713729 | 10 | 0 | 10 |
| TNIP1 | CTTNBP2NL | 0.713097 | 7 | 0 | 6 |
| TNIP1 | GPBP1 | 0.711357 | 3 | 0 | 3 |
| TNIP1 | RNASEK | 0.711027 | 3 | 0 | 3 |
| TNIP1 | FAM155A | 0.70957 | 3 | 0 | 3 |
For details and further investigation, click here