| Full name: tripartite motif containing 13 | Alias Symbol: Leu5|RNF77|DLEU5 | ||
| Type: protein-coding gene | Cytoband: 13q14.2 | ||
| Entrez ID: 10206 | HGNC ID: HGNC:9976 | Ensembl Gene: ENSG00000204977 | OMIM ID: 605661 |
Expression of TRIM13:
| Dataset | Gene | EntrezID | Probe | Log2FC | Adj.pValue | Expression |
|---|---|---|---|---|---|---|
| GSE17351 | TRIM13 | 10206 | 203659_s_at | -1.1171 | 0.0103 | |
| GSE20347 | TRIM13 | 10206 | 203659_s_at | -1.4705 | 0.0000 | |
| GSE23400 | TRIM13 | 10206 | 203659_s_at | -0.8182 | 0.0000 | |
| GSE26886 | TRIM13 | 10206 | 230192_at | -2.5988 | 0.0000 | |
| GSE29001 | TRIM13 | 10206 | 203659_s_at | -1.1803 | 0.0006 | |
| GSE38129 | TRIM13 | 10206 | 203659_s_at | -1.1029 | 0.0000 | |
| GSE45670 | TRIM13 | 10206 | 203659_s_at | -0.5819 | 0.0009 | |
| GSE53622 | TRIM13 | 10206 | 36317 | -0.8528 | 0.0000 | |
| GSE53624 | TRIM13 | 10206 | 36317 | -1.1922 | 0.0000 | |
| GSE63941 | TRIM13 | 10206 | 203659_s_at | -0.1557 | 0.6819 | |
| GSE77861 | TRIM13 | 10206 | 229943_at | -0.9510 | 0.0290 | |
| GSE97050 | TRIM13 | 10206 | A_23_P87973 | -0.1477 | 0.6565 | |
| SRP007169 | TRIM13 | 10206 | RNAseq | -1.9082 | 0.0000 | |
| SRP008496 | TRIM13 | 10206 | RNAseq | -1.5906 | 0.0000 | |
| SRP064894 | TRIM13 | 10206 | RNAseq | -0.7554 | 0.0000 | |
| SRP133303 | TRIM13 | 10206 | RNAseq | -0.5419 | 0.0048 | |
| SRP159526 | TRIM13 | 10206 | RNAseq | -1.1921 | 0.0000 | |
| SRP193095 | TRIM13 | 10206 | RNAseq | -1.1087 | 0.0000 | |
| SRP219564 | TRIM13 | 10206 | RNAseq | -0.9891 | 0.0014 | |
| TCGA | TRIM13 | 10206 | RNAseq | -0.1499 | 0.0063 |
Upregulated datasets: 0; Downregulated datasets: 10.
Survival by TRIM13 expression:
 | 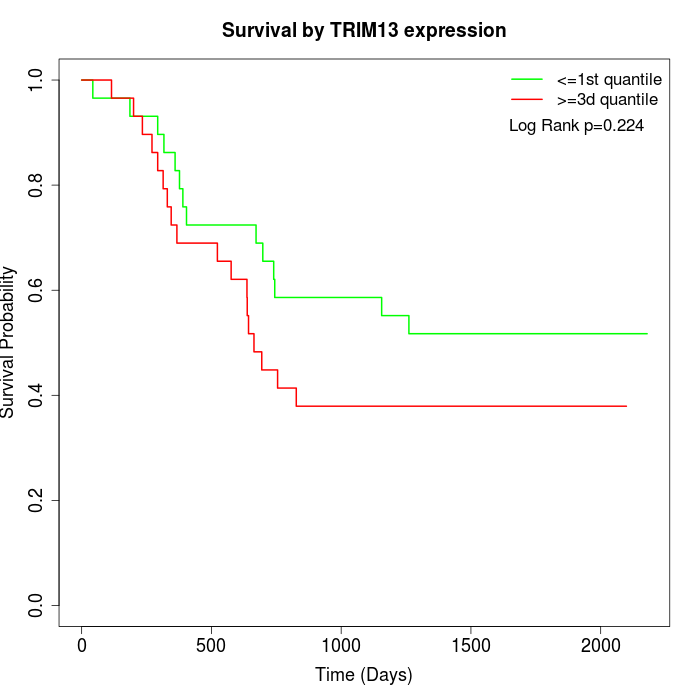 | 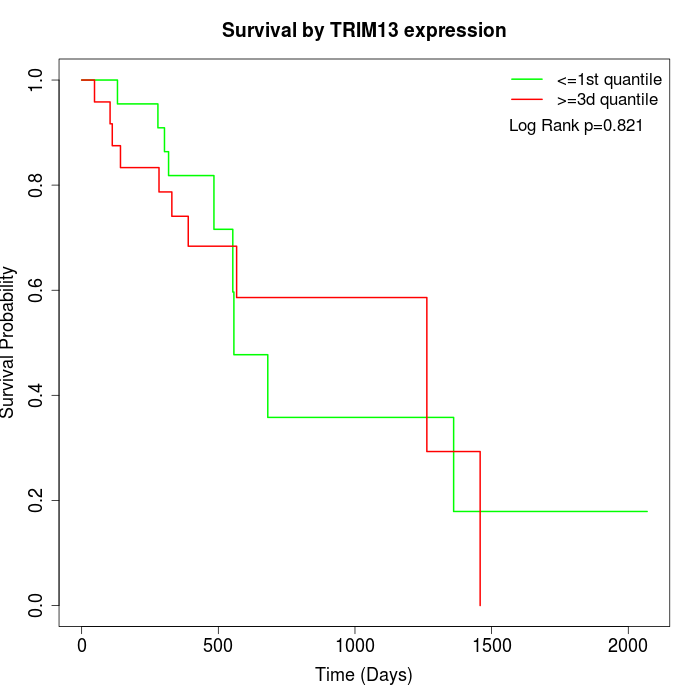 |
| GSE53622 | GSE53624 | TCGA |
Note: Click image to view full size file.
Copy number change of TRIM13:
| Dataset | Gene | EntrezID | Gain | Loss | Normal | Detail |
|---|---|---|---|---|---|---|
| GSE15526 | TRIM13 | 10206 | 1 | 13 | 16 | |
| GSE20123 | TRIM13 | 10206 | 1 | 12 | 17 | |
| GSE43470 | TRIM13 | 10206 | 3 | 13 | 27 | |
| GSE46452 | TRIM13 | 10206 | 0 | 32 | 27 | |
| GSE47630 | TRIM13 | 10206 | 2 | 27 | 11 | |
| GSE54993 | TRIM13 | 10206 | 12 | 2 | 56 | |
| GSE54994 | TRIM13 | 10206 | 2 | 14 | 37 | |
| GSE60625 | TRIM13 | 10206 | 0 | 3 | 8 | |
| GSE74703 | TRIM13 | 10206 | 3 | 10 | 23 | |
| GSE74704 | TRIM13 | 10206 | 0 | 9 | 11 | |
| TCGA | TRIM13 | 10206 | 9 | 37 | 50 |
Total number of gains: 33; Total number of losses: 172; Total Number of normals: 283.
Somatic mutations of TRIM13:
Generating mutation plots.
Highly correlated genes for TRIM13:
Showing top 20/1414 corelated genes with mean PCC>0.5.
| Gene1 | Gene2 | Mean PCC | Num. Datasets | Num. PCC<0 | Num. PCC>0.5 |
|---|---|---|---|---|---|
| TRIM13 | CPEB3 | 0.80399 | 10 | 0 | 10 |
| TRIM13 | GALNT11 | 0.787897 | 3 | 0 | 3 |
| TRIM13 | SASH1 | 0.787307 | 11 | 0 | 10 |
| TRIM13 | CA13 | 0.775388 | 3 | 0 | 3 |
| TRIM13 | KAT2B | 0.773718 | 11 | 0 | 11 |
| TRIM13 | RNF141 | 0.769559 | 11 | 0 | 11 |
| TRIM13 | SORT1 | 0.767627 | 11 | 0 | 11 |
| TRIM13 | SH3BGRL2 | 0.766793 | 7 | 0 | 7 |
| TRIM13 | CIPC | 0.766067 | 6 | 0 | 6 |
| TRIM13 | HBP1 | 0.764614 | 9 | 0 | 9 |
| TRIM13 | HPGD | 0.761773 | 11 | 0 | 11 |
| TRIM13 | GPD1L | 0.760784 | 11 | 0 | 11 |
| TRIM13 | NUCB2 | 0.759469 | 11 | 0 | 11 |
| TRIM13 | PMM1 | 0.759407 | 10 | 0 | 10 |
| TRIM13 | RMND5B | 0.756634 | 11 | 0 | 10 |
| TRIM13 | CYP2J2 | 0.753597 | 10 | 0 | 10 |
| TRIM13 | LNX1 | 0.753119 | 7 | 0 | 7 |
| TRIM13 | KRT4 | 0.752155 | 9 | 0 | 9 |
| TRIM13 | SLC10A5 | 0.751235 | 3 | 0 | 3 |
| TRIM13 | SCNN1B | 0.750062 | 10 | 0 | 10 |
For details and further investigation, click here