| Full name: thymic stromal lymphopoietin | Alias Symbol: | ||
| Type: protein-coding gene | Cytoband: 5q22.1 | ||
| Entrez ID: 85480 | HGNC ID: HGNC:30743 | Ensembl Gene: ENSG00000145777 | OMIM ID: 607003 |
TSLP involved pathways:
| KEGG pathway | Description | View |
|---|---|---|
| hsa04630 | Jak-STAT signaling pathway |
Expression of TSLP:
| Dataset | Gene | EntrezID | Probe | Log2FC | Adj.pValue | Expression |
|---|---|---|---|---|---|---|
| GSE17351 | TSLP | 85480 | 235737_at | -1.4261 | 0.3158 | |
| GSE26886 | TSLP | 85480 | 235737_at | -0.3260 | 0.5371 | |
| GSE45670 | TSLP | 85480 | 235737_at | -0.6222 | 0.2016 | |
| GSE53622 | TSLP | 85480 | 113995 | -1.3856 | 0.0000 | |
| GSE53624 | TSLP | 85480 | 113995 | -1.6121 | 0.0000 | |
| GSE63941 | TSLP | 85480 | 235737_at | -3.8138 | 0.0043 | |
| GSE77861 | TSLP | 85480 | 235737_at | -0.4733 | 0.0730 | |
| SRP007169 | TSLP | 85480 | RNAseq | -2.7137 | 0.0002 | |
| SRP064894 | TSLP | 85480 | RNAseq | -0.5238 | 0.1825 | |
| SRP133303 | TSLP | 85480 | RNAseq | 0.2624 | 0.6493 | |
| SRP159526 | TSLP | 85480 | RNAseq | -0.8860 | 0.0000 | |
| SRP219564 | TSLP | 85480 | RNAseq | -1.8827 | 0.0018 | |
| TCGA | TSLP | 85480 | RNAseq | 0.4700 | 0.0442 |
Upregulated datasets: 0; Downregulated datasets: 5.
Survival by TSLP expression:
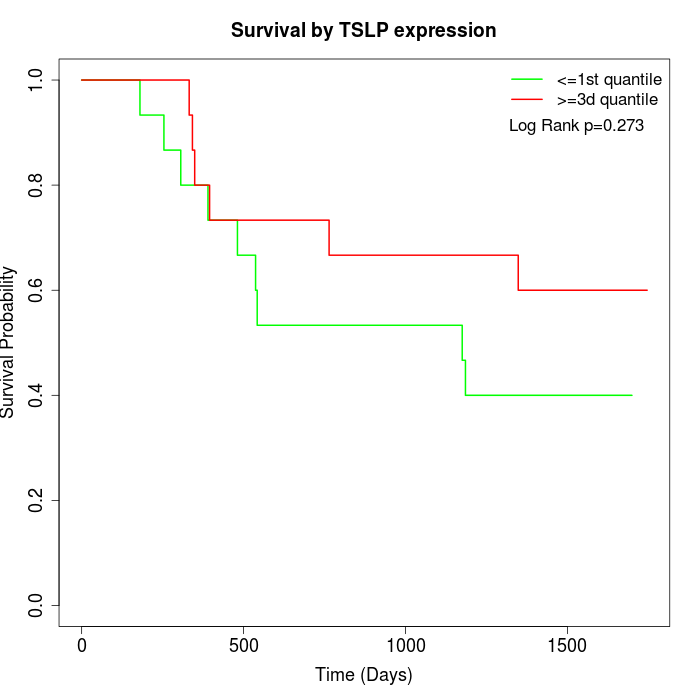 | 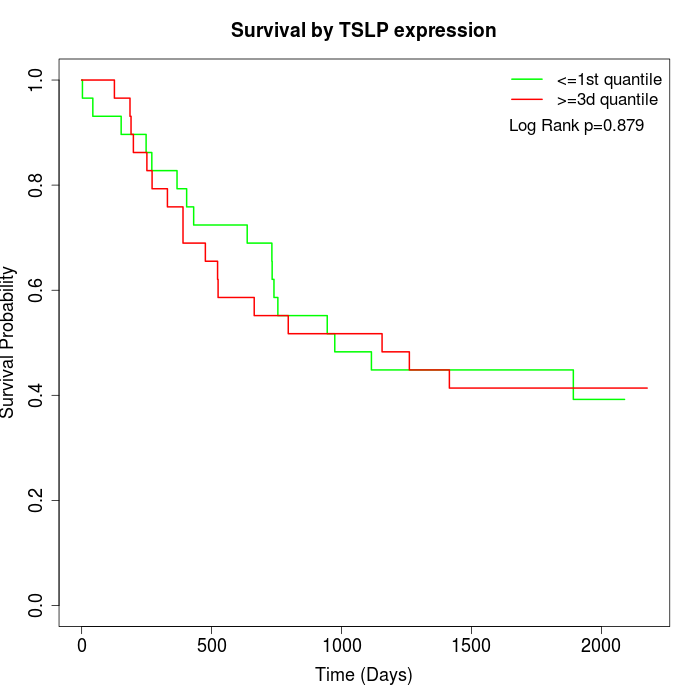 | 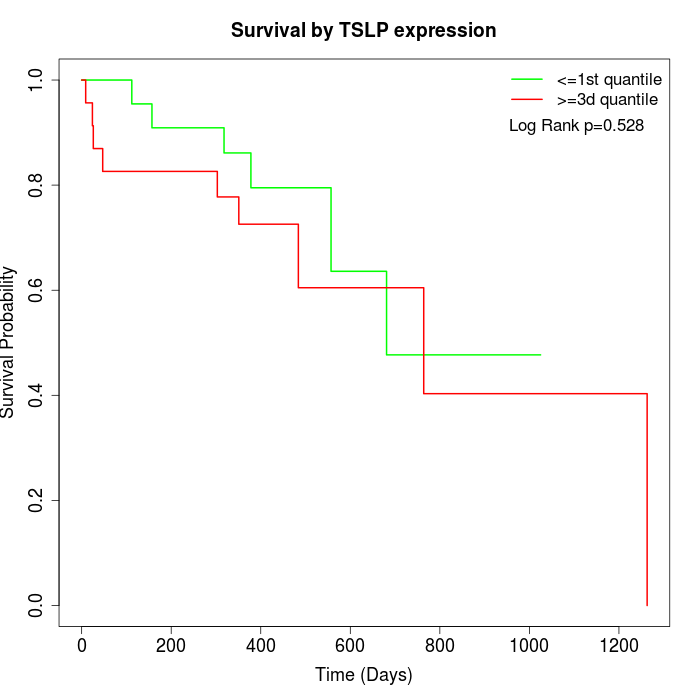 |
| GSE53622 | GSE53624 | TCGA |
Note: Click image to view full size file.
Copy number change of TSLP:
| Dataset | Gene | EntrezID | Gain | Loss | Normal | Detail |
|---|---|---|---|---|---|---|
| GSE15526 | TSLP | 85480 | 1 | 13 | 16 | |
| GSE20123 | TSLP | 85480 | 1 | 13 | 16 | |
| GSE43470 | TSLP | 85480 | 3 | 8 | 32 | |
| GSE46452 | TSLP | 85480 | 0 | 28 | 31 | |
| GSE47630 | TSLP | 85480 | 0 | 21 | 19 | |
| GSE54993 | TSLP | 85480 | 9 | 1 | 60 | |
| GSE54994 | TSLP | 85480 | 1 | 17 | 35 | |
| GSE60625 | TSLP | 85480 | 0 | 0 | 11 | |
| GSE74703 | TSLP | 85480 | 2 | 6 | 28 | |
| GSE74704 | TSLP | 85480 | 1 | 7 | 12 | |
| TCGA | TSLP | 85480 | 2 | 41 | 53 |
Total number of gains: 20; Total number of losses: 155; Total Number of normals: 313.
Somatic mutations of TSLP:
Generating mutation plots.
Highly correlated genes for TSLP:
Showing top 20/373 corelated genes with mean PCC>0.5.
| Gene1 | Gene2 | Mean PCC | Num. Datasets | Num. PCC<0 | Num. PCC>0.5 |
|---|---|---|---|---|---|
| TSLP | RPL10A | 0.664535 | 4 | 0 | 4 |
| TSLP | TSPYL1 | 0.657667 | 4 | 0 | 4 |
| TSLP | MCEE | 0.640148 | 5 | 0 | 4 |
| TSLP | HADHB | 0.639733 | 5 | 0 | 4 |
| TSLP | COX7C | 0.635703 | 4 | 0 | 3 |
| TSLP | SCAPER | 0.635564 | 3 | 0 | 3 |
| TSLP | FAM162B | 0.634942 | 3 | 0 | 3 |
| TSLP | PALMD | 0.632183 | 4 | 0 | 3 |
| TSLP | HS3ST1 | 0.625655 | 4 | 0 | 4 |
| TSLP | WDR47 | 0.624122 | 3 | 0 | 3 |
| TSLP | LMO2 | 0.622485 | 5 | 0 | 4 |
| TSLP | SPRR3 | 0.620158 | 4 | 0 | 3 |
| TSLP | CLCA4 | 0.61434 | 5 | 0 | 4 |
| TSLP | SPINK5 | 0.613466 | 5 | 0 | 5 |
| TSLP | EFNA5 | 0.612857 | 3 | 0 | 3 |
| TSLP | RUFY1 | 0.61048 | 5 | 0 | 4 |
| TSLP | HOOK3 | 0.608794 | 4 | 0 | 3 |
| TSLP | ATOH8 | 0.604308 | 3 | 0 | 3 |
| TSLP | HACE1 | 0.604039 | 4 | 0 | 4 |
| TSLP | ECHDC1 | 0.601188 | 3 | 0 | 3 |
For details and further investigation, click here