| Full name: tetraspanin 13 | Alias Symbol: NET-6 | ||
| Type: protein-coding gene | Cytoband: 7p21.1 | ||
| Entrez ID: 27075 | HGNC ID: HGNC:21643 | Ensembl Gene: ENSG00000106537 | OMIM ID: 613139 |
Expression of TSPAN13:
| Dataset | Gene | EntrezID | Probe | Log2FC | Adj.pValue | Expression |
|---|---|---|---|---|---|---|
| GSE17351 | TSPAN13 | 27075 | 217979_at | 0.4043 | 0.5672 | |
| GSE20347 | TSPAN13 | 27075 | 217979_at | 0.1420 | 0.4857 | |
| GSE23400 | TSPAN13 | 27075 | 217979_at | 0.4237 | 0.0010 | |
| GSE26886 | TSPAN13 | 27075 | 217979_at | 0.2018 | 0.3357 | |
| GSE29001 | TSPAN13 | 27075 | 217979_at | 0.0457 | 0.8632 | |
| GSE38129 | TSPAN13 | 27075 | 217979_at | 0.3578 | 0.0564 | |
| GSE45670 | TSPAN13 | 27075 | 217979_at | 0.4797 | 0.0484 | |
| GSE53622 | TSPAN13 | 27075 | 73107 | 0.3248 | 0.0358 | |
| GSE53624 | TSPAN13 | 27075 | 73107 | -0.1037 | 0.3841 | |
| GSE63941 | TSPAN13 | 27075 | 217979_at | 2.7140 | 0.0011 | |
| GSE77861 | TSPAN13 | 27075 | 217979_at | 0.0594 | 0.8651 | |
| GSE97050 | TSPAN13 | 27075 | A_23_P168610 | 1.0419 | 0.2477 | |
| SRP007169 | TSPAN13 | 27075 | RNAseq | -0.4378 | 0.3257 | |
| SRP008496 | TSPAN13 | 27075 | RNAseq | 0.0074 | 0.9843 | |
| SRP064894 | TSPAN13 | 27075 | RNAseq | -0.3296 | 0.3129 | |
| SRP133303 | TSPAN13 | 27075 | RNAseq | 0.2979 | 0.4964 | |
| SRP159526 | TSPAN13 | 27075 | RNAseq | 0.7140 | 0.1037 | |
| SRP193095 | TSPAN13 | 27075 | RNAseq | -0.0781 | 0.7908 | |
| SRP219564 | TSPAN13 | 27075 | RNAseq | 0.8559 | 0.1265 | |
| TCGA | TSPAN13 | 27075 | RNAseq | -0.0932 | 0.3431 |
Upregulated datasets: 1; Downregulated datasets: 0.
Survival by TSPAN13 expression:
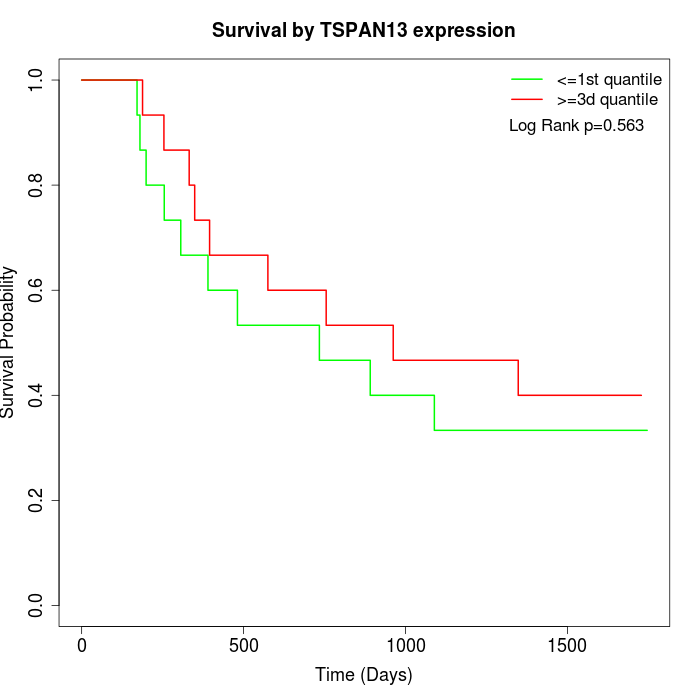 | 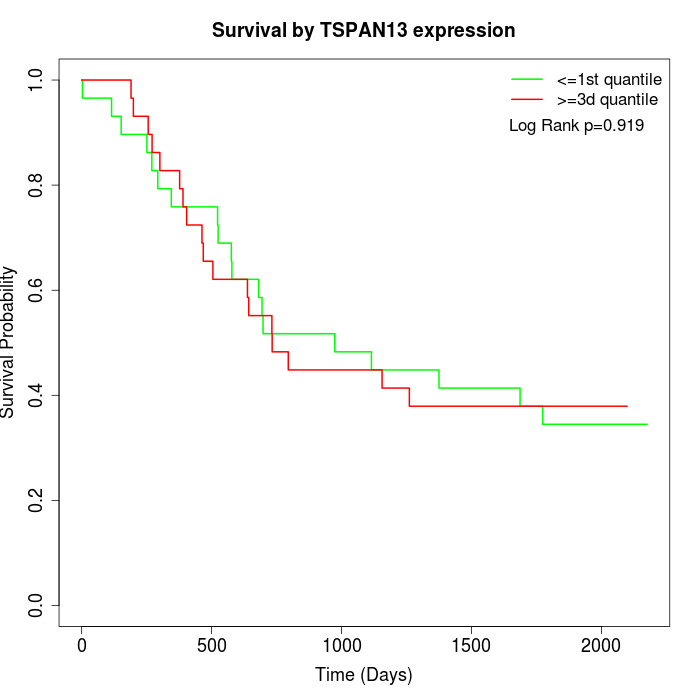 | 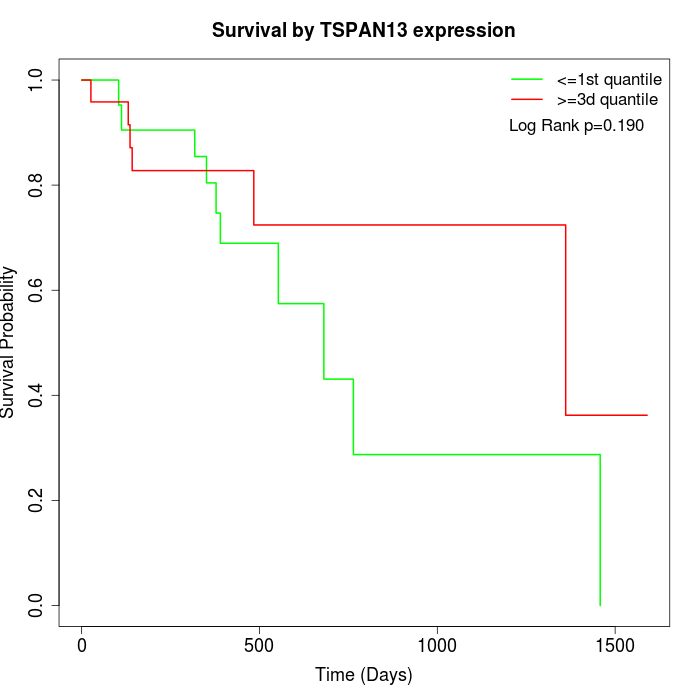 |
| GSE53622 | GSE53624 | TCGA |
Note: Click image to view full size file.
Copy number change of TSPAN13:
| Dataset | Gene | EntrezID | Gain | Loss | Normal | Detail |
|---|---|---|---|---|---|---|
| GSE15526 | TSPAN13 | 27075 | 15 | 2 | 13 | |
| GSE20123 | TSPAN13 | 27075 | 15 | 2 | 13 | |
| GSE43470 | TSPAN13 | 27075 | 5 | 0 | 38 | |
| GSE46452 | TSPAN13 | 27075 | 11 | 1 | 47 | |
| GSE47630 | TSPAN13 | 27075 | 9 | 1 | 30 | |
| GSE54993 | TSPAN13 | 27075 | 0 | 6 | 64 | |
| GSE54994 | TSPAN13 | 27075 | 21 | 1 | 31 | |
| GSE60625 | TSPAN13 | 27075 | 0 | 0 | 11 | |
| GSE74703 | TSPAN13 | 27075 | 5 | 0 | 31 | |
| GSE74704 | TSPAN13 | 27075 | 9 | 2 | 9 | |
| TCGA | TSPAN13 | 27075 | 56 | 5 | 35 |
Total number of gains: 146; Total number of losses: 20; Total Number of normals: 322.
Somatic mutations of TSPAN13:
Generating mutation plots.
Highly correlated genes for TSPAN13:
Showing top 20/84 corelated genes with mean PCC>0.5.
| Gene1 | Gene2 | Mean PCC | Num. Datasets | Num. PCC<0 | Num. PCC>0.5 |
|---|---|---|---|---|---|
| TSPAN13 | CEP135 | 0.723034 | 3 | 0 | 3 |
| TSPAN13 | SDR42E1 | 0.697103 | 3 | 0 | 3 |
| TSPAN13 | TCF7 | 0.6794 | 3 | 0 | 3 |
| TSPAN13 | STAP2 | 0.642822 | 3 | 0 | 3 |
| TSPAN13 | MYO19 | 0.637116 | 4 | 0 | 3 |
| TSPAN13 | DPF1 | 0.634268 | 3 | 0 | 3 |
| TSPAN13 | CHAC2 | 0.630161 | 4 | 0 | 3 |
| TSPAN13 | MTFP1 | 0.620754 | 4 | 0 | 3 |
| TSPAN13 | TFAP2C | 0.616045 | 4 | 0 | 4 |
| TSPAN13 | RAP1GAP2 | 0.613353 | 4 | 0 | 3 |
| TSPAN13 | TLCD1 | 0.612404 | 4 | 0 | 4 |
| TSPAN13 | MARVELD3 | 0.609948 | 4 | 0 | 4 |
| TSPAN13 | PPP1R14C | 0.60947 | 4 | 0 | 3 |
| TSPAN13 | SDC1 | 0.597266 | 6 | 0 | 4 |
| TSPAN13 | MARVELD2 | 0.592904 | 4 | 0 | 3 |
| TSPAN13 | GRHL2 | 0.590811 | 6 | 0 | 5 |
| TSPAN13 | DEPDC1B | 0.587468 | 5 | 0 | 3 |
| TSPAN13 | ASF1B | 0.586308 | 5 | 0 | 3 |
| TSPAN13 | AP1S3 | 0.583137 | 5 | 0 | 3 |
| TSPAN13 | FAM83H | 0.581785 | 4 | 0 | 3 |
For details and further investigation, click here