| Full name: alpha tocopherol transfer protein | Alias Symbol: | ||
| Type: protein-coding gene | Cytoband: 8q12.3 | ||
| Entrez ID: 7274 | HGNC ID: HGNC:12404 | Ensembl Gene: ENSG00000137561 | OMIM ID: 600415 |
Expression of TTPA:
| Dataset | Gene | EntrezID | Probe | Log2FC | Adj.pValue | Expression |
|---|---|---|---|---|---|---|
| GSE17351 | TTPA | 7274 | 210614_at | 0.1698 | 0.5024 | |
| GSE20347 | TTPA | 7274 | 210614_at | 0.0807 | 0.2706 | |
| GSE23400 | TTPA | 7274 | 210614_at | -0.1435 | 0.0005 | |
| GSE26886 | TTPA | 7274 | 210614_at | 0.0504 | 0.6220 | |
| GSE29001 | TTPA | 7274 | 210614_at | -0.0132 | 0.9090 | |
| GSE38129 | TTPA | 7274 | 210614_at | -0.0007 | 0.9928 | |
| GSE45670 | TTPA | 7274 | 210614_at | 0.0734 | 0.4951 | |
| GSE53622 | TTPA | 7274 | 22617 | -0.4318 | 0.0191 | |
| GSE53624 | TTPA | 7274 | 22617 | -0.3206 | 0.0165 | |
| GSE63941 | TTPA | 7274 | 210614_at | -0.0491 | 0.8284 | |
| GSE77861 | TTPA | 7274 | 210614_at | -0.1362 | 0.1743 | |
| SRP133303 | TTPA | 7274 | RNAseq | -0.1726 | 0.4113 | |
| TCGA | TTPA | 7274 | RNAseq | -1.7625 | 0.0328 |
Upregulated datasets: 0; Downregulated datasets: 1.
Survival by TTPA expression:
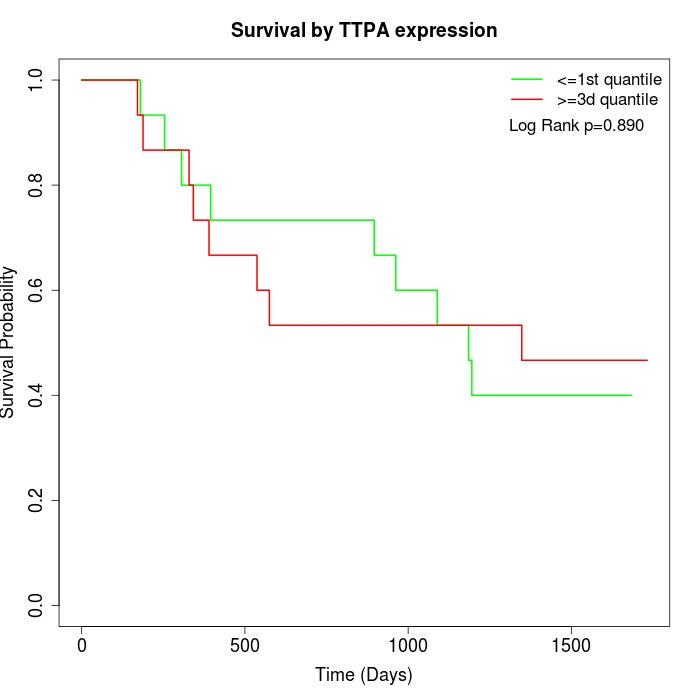 | 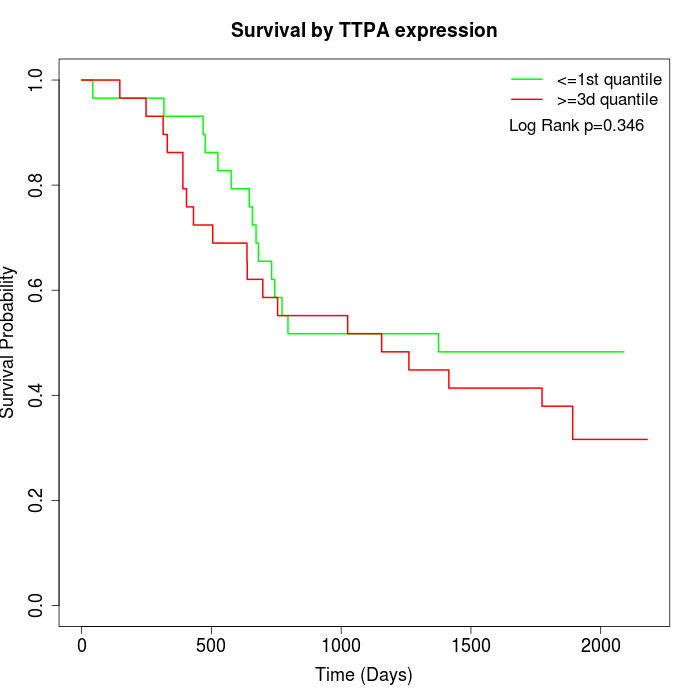 | 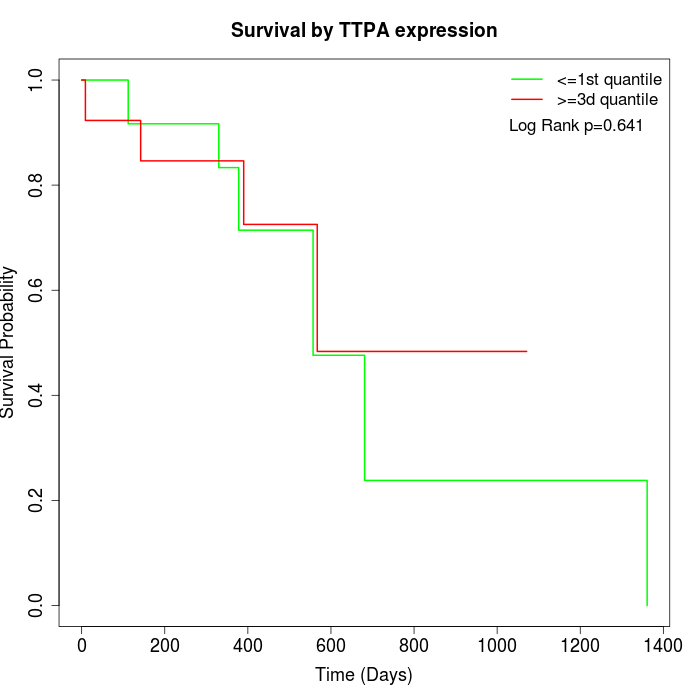 |
| GSE53622 | GSE53624 | TCGA |
Note: Click image to view full size file.
Copy number change of TTPA:
| Dataset | Gene | EntrezID | Gain | Loss | Normal | Detail |
|---|---|---|---|---|---|---|
| GSE15526 | TTPA | 7274 | 13 | 1 | 16 | |
| GSE20123 | TTPA | 7274 | 13 | 1 | 16 | |
| GSE43470 | TTPA | 7274 | 15 | 3 | 25 | |
| GSE46452 | TTPA | 7274 | 21 | 1 | 37 | |
| GSE47630 | TTPA | 7274 | 23 | 1 | 16 | |
| GSE54993 | TTPA | 7274 | 1 | 18 | 51 | |
| GSE54994 | TTPA | 7274 | 30 | 0 | 23 | |
| GSE60625 | TTPA | 7274 | 0 | 4 | 7 | |
| GSE74703 | TTPA | 7274 | 13 | 2 | 21 | |
| GSE74704 | TTPA | 7274 | 9 | 0 | 11 | |
| TCGA | TTPA | 7274 | 45 | 6 | 45 |
Total number of gains: 183; Total number of losses: 37; Total Number of normals: 268.
Somatic mutations of TTPA:
Generating mutation plots.
Highly correlated genes for TTPA:
Showing top 20/237 corelated genes with mean PCC>0.5.
| Gene1 | Gene2 | Mean PCC | Num. Datasets | Num. PCC<0 | Num. PCC>0.5 |
|---|---|---|---|---|---|
| TTPA | CSH1 | 0.703498 | 3 | 0 | 3 |
| TTPA | NPY2R | 0.699333 | 3 | 0 | 3 |
| TTPA | NDUFB2-AS1 | 0.666625 | 3 | 0 | 3 |
| TTPA | MMP19 | 0.659402 | 4 | 0 | 4 |
| TTPA | TMPRSS6 | 0.648362 | 3 | 0 | 3 |
| TTPA | SPP2 | 0.639585 | 3 | 0 | 3 |
| TTPA | CGA | 0.636145 | 3 | 0 | 3 |
| TTPA | SHANK1 | 0.632909 | 4 | 0 | 3 |
| TTPA | CHAT | 0.632221 | 3 | 0 | 3 |
| TTPA | VGF | 0.631106 | 3 | 0 | 3 |
| TTPA | MAPK11 | 0.630343 | 3 | 0 | 3 |
| TTPA | SLC10A1 | 0.629076 | 3 | 0 | 3 |
| TTPA | PLCB2 | 0.627756 | 3 | 0 | 3 |
| TTPA | DAB1 | 0.626749 | 3 | 0 | 3 |
| TTPA | PRDM11 | 0.623785 | 4 | 0 | 4 |
| TTPA | IL1RAPL2 | 0.622881 | 4 | 0 | 4 |
| TTPA | F2 | 0.622131 | 3 | 0 | 3 |
| TTPA | CALCA | 0.620004 | 3 | 0 | 3 |
| TTPA | HKDC1 | 0.619879 | 3 | 0 | 3 |
| TTPA | PRKAR2A | 0.619035 | 3 | 0 | 3 |
For details and further investigation, click here