| Full name: tumor suppressor 2, mitochondrial calcium regulator | Alias Symbol: FUS1|PAP|C3orf11 | ||
| Type: protein-coding gene | Cytoband: 3p21.31 | ||
| Entrez ID: 11334 | HGNC ID: HGNC:17034 | Ensembl Gene: ENSG00000114383 | OMIM ID: 607052 |
Expression of TUSC2:
| Dataset | Gene | EntrezID | Probe | Log2FC | Adj.pValue | Expression |
|---|---|---|---|---|---|---|
| GSE17351 | TUSC2 | 11334 | 203272_s_at | 0.2203 | 0.4553 | |
| GSE20347 | TUSC2 | 11334 | 203272_s_at | -0.5517 | 0.0033 | |
| GSE23400 | TUSC2 | 11334 | 203272_s_at | -0.2302 | 0.0000 | |
| GSE26886 | TUSC2 | 11334 | 203273_s_at | -0.1268 | 0.4161 | |
| GSE29001 | TUSC2 | 11334 | 203272_s_at | -0.4904 | 0.1048 | |
| GSE38129 | TUSC2 | 11334 | 203272_s_at | -0.2550 | 0.0892 | |
| GSE45670 | TUSC2 | 11334 | 203272_s_at | -0.0243 | 0.8798 | |
| GSE53622 | TUSC2 | 11334 | 84157 | -0.2682 | 0.0000 | |
| GSE53624 | TUSC2 | 11334 | 6232 | -0.5300 | 0.0000 | |
| GSE63941 | TUSC2 | 11334 | 203272_s_at | 0.0889 | 0.8028 | |
| GSE77861 | TUSC2 | 11334 | 203272_s_at | -0.4309 | 0.0195 | |
| GSE97050 | TUSC2 | 11334 | A_23_P251562 | -0.2707 | 0.2533 | |
| SRP007169 | TUSC2 | 11334 | RNAseq | -0.3714 | 0.3319 | |
| SRP008496 | TUSC2 | 11334 | RNAseq | -0.2968 | 0.2711 | |
| SRP064894 | TUSC2 | 11334 | RNAseq | -0.0890 | 0.7331 | |
| SRP133303 | TUSC2 | 11334 | RNAseq | -0.3167 | 0.0527 | |
| SRP159526 | TUSC2 | 11334 | RNAseq | -0.3612 | 0.1421 | |
| SRP193095 | TUSC2 | 11334 | RNAseq | -0.5225 | 0.0001 | |
| SRP219564 | TUSC2 | 11334 | RNAseq | -0.4406 | 0.2105 | |
| TCGA | TUSC2 | 11334 | RNAseq | -0.3390 | 0.0000 |
Upregulated datasets: 0; Downregulated datasets: 0.
Survival by TUSC2 expression:
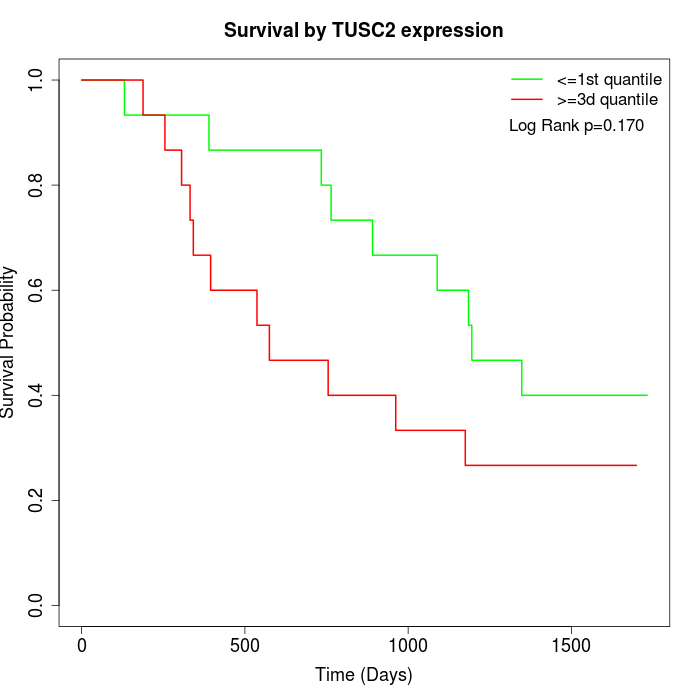 | 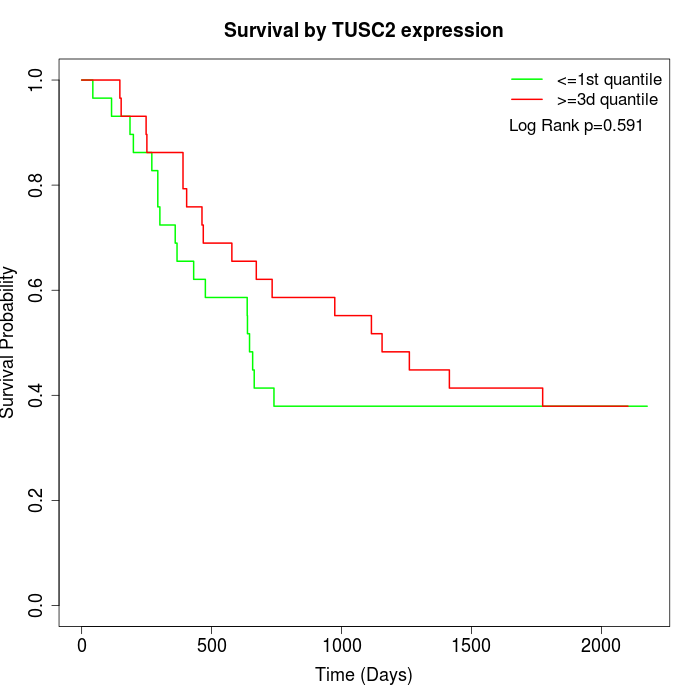 | 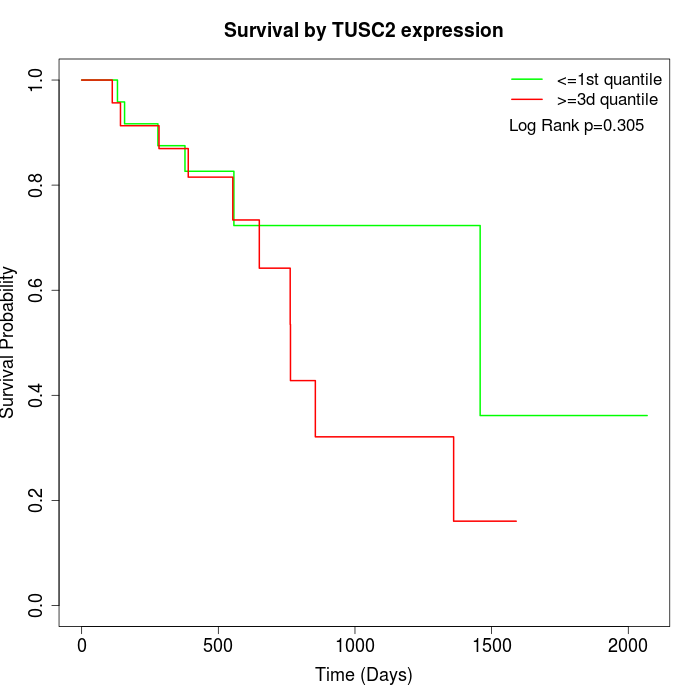 |
| GSE53622 | GSE53624 | TCGA |
Note: Click image to view full size file.
Copy number change of TUSC2:
| Dataset | Gene | EntrezID | Gain | Loss | Normal | Detail |
|---|---|---|---|---|---|---|
| GSE15526 | TUSC2 | 11334 | 0 | 18 | 12 | |
| GSE20123 | TUSC2 | 11334 | 0 | 19 | 11 | |
| GSE43470 | TUSC2 | 11334 | 0 | 19 | 24 | |
| GSE46452 | TUSC2 | 11334 | 2 | 16 | 41 | |
| GSE47630 | TUSC2 | 11334 | 1 | 24 | 15 | |
| GSE54993 | TUSC2 | 11334 | 6 | 2 | 62 | |
| GSE54994 | TUSC2 | 11334 | 1 | 33 | 19 | |
| GSE60625 | TUSC2 | 11334 | 5 | 0 | 6 | |
| GSE74703 | TUSC2 | 11334 | 0 | 15 | 21 | |
| GSE74704 | TUSC2 | 11334 | 0 | 12 | 8 | |
| TCGA | TUSC2 | 11334 | 0 | 78 | 18 |
Total number of gains: 15; Total number of losses: 236; Total Number of normals: 237.
Somatic mutations of TUSC2:
Generating mutation plots.
Highly correlated genes for TUSC2:
Showing top 20/154 corelated genes with mean PCC>0.5.
| Gene1 | Gene2 | Mean PCC | Num. Datasets | Num. PCC<0 | Num. PCC>0.5 |
|---|---|---|---|---|---|
| TUSC2 | ZNF777 | 0.739441 | 3 | 0 | 3 |
| TUSC2 | TNNI2 | 0.720881 | 3 | 0 | 3 |
| TUSC2 | FAM71A | 0.719622 | 3 | 0 | 3 |
| TUSC2 | RPUSD1 | 0.688444 | 3 | 0 | 3 |
| TUSC2 | ADAM21 | 0.664222 | 3 | 0 | 3 |
| TUSC2 | RTCA | 0.662059 | 4 | 0 | 3 |
| TUSC2 | ADAMTS17 | 0.63911 | 3 | 0 | 3 |
| TUSC2 | GOLGA6L6 | 0.639025 | 3 | 0 | 3 |
| TUSC2 | SHQ1 | 0.633517 | 4 | 0 | 3 |
| TUSC2 | PSPN | 0.626409 | 4 | 0 | 3 |
| TUSC2 | FGF6 | 0.626247 | 4 | 0 | 4 |
| TUSC2 | CLCNKB | 0.623309 | 4 | 0 | 3 |
| TUSC2 | GATA4 | 0.619616 | 4 | 0 | 3 |
| TUSC2 | DNAL4 | 0.619476 | 4 | 0 | 3 |
| TUSC2 | OPTC | 0.619188 | 3 | 0 | 3 |
| TUSC2 | FASTK | 0.609803 | 4 | 0 | 4 |
| TUSC2 | PAX8 | 0.608604 | 3 | 0 | 3 |
| TUSC2 | KCNT1 | 0.607674 | 4 | 0 | 3 |
| TUSC2 | BEST4 | 0.607412 | 4 | 0 | 3 |
| TUSC2 | NDUFB2-AS1 | 0.603978 | 4 | 0 | 3 |
For details and further investigation, click here