| Full name: uncoupling protein 1 | Alias Symbol: SLC25A7 | ||
| Type: protein-coding gene | Cytoband: 4q31.1 | ||
| Entrez ID: 7350 | HGNC ID: HGNC:12517 | Ensembl Gene: ENSG00000109424 | OMIM ID: 113730 |
| Related drugs: STREPTOZOTOCIN... [more] | |||
UCP1 involved pathways:
| KEGG pathway | Description | View |
|---|---|---|
| hsa03320 | PPAR signaling pathway |
Expression of UCP1:
| Dataset | Gene | EntrezID | Probe | Log2FC | Adj.pValue | Expression |
|---|---|---|---|---|---|---|
| GSE17351 | UCP1 | 7350 | 221384_at | -0.0249 | 0.9394 | |
| GSE20347 | UCP1 | 7350 | 221384_at | -0.0214 | 0.7672 | |
| GSE23400 | UCP1 | 7350 | 221384_at | -0.0850 | 0.0004 | |
| GSE26886 | UCP1 | 7350 | 221384_at | 0.0398 | 0.7710 | |
| GSE29001 | UCP1 | 7350 | 221384_at | -0.2359 | 0.0671 | |
| GSE38129 | UCP1 | 7350 | 221384_at | -0.1372 | 0.0626 | |
| GSE45670 | UCP1 | 7350 | 221384_at | 0.1098 | 0.1967 | |
| GSE53622 | UCP1 | 7350 | 56925 | 0.2198 | 0.0886 | |
| GSE53624 | UCP1 | 7350 | 56925 | 0.7020 | 0.0000 | |
| GSE63941 | UCP1 | 7350 | 221384_at | 0.1407 | 0.6625 | |
| GSE77861 | UCP1 | 7350 | 221384_at | -0.2241 | 0.0538 | |
| TCGA | UCP1 | 7350 | RNAseq | 1.3363 | 0.4296 |
Upregulated datasets: 0; Downregulated datasets: 0.
Survival by UCP1 expression:
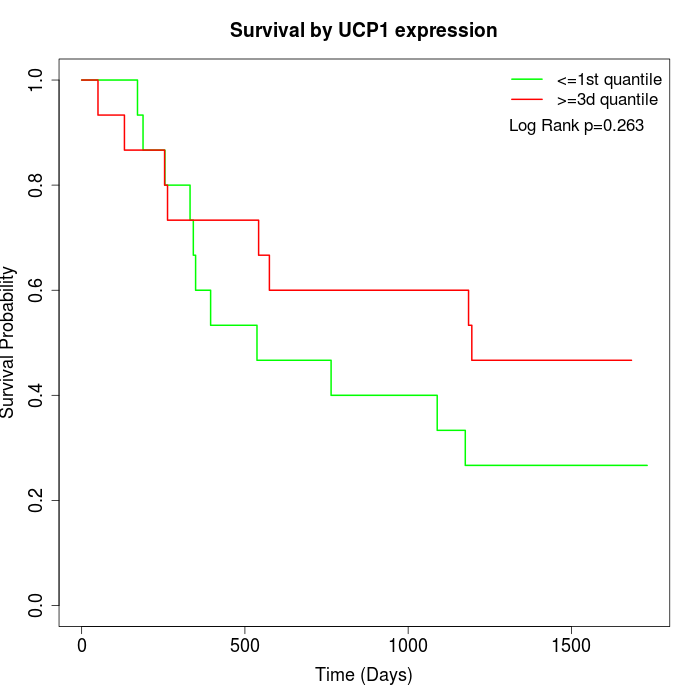 | 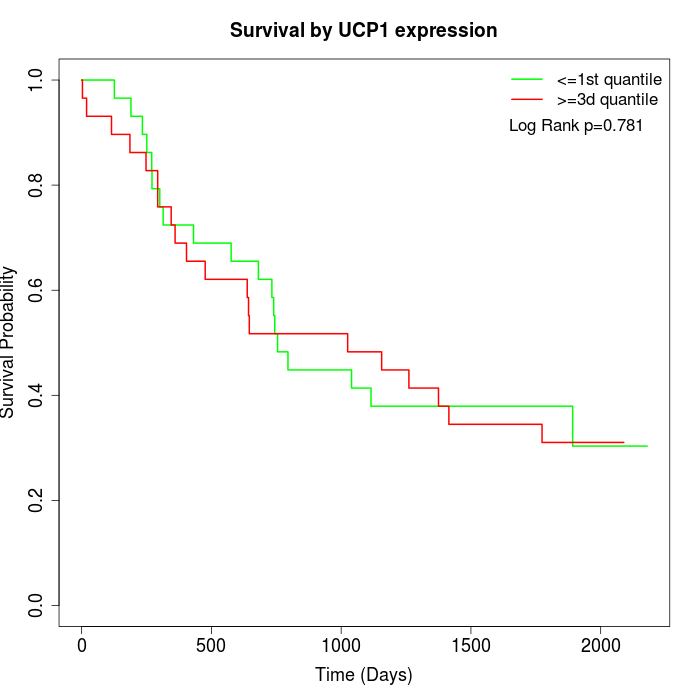 | 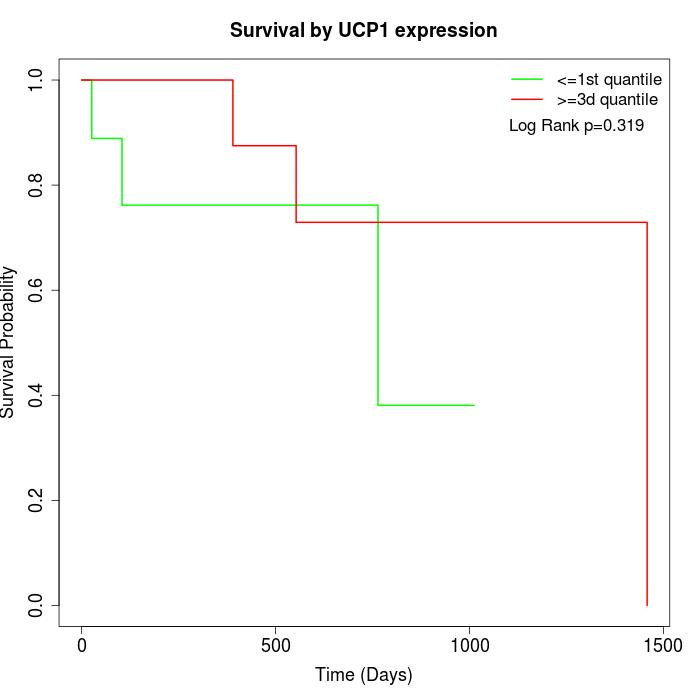 |
| GSE53622 | GSE53624 | TCGA |
Note: Click image to view full size file.
Copy number change of UCP1:
| Dataset | Gene | EntrezID | Gain | Loss | Normal | Detail |
|---|---|---|---|---|---|---|
| GSE15526 | UCP1 | 7350 | 0 | 12 | 18 | |
| GSE20123 | UCP1 | 7350 | 0 | 12 | 18 | |
| GSE43470 | UCP1 | 7350 | 0 | 13 | 30 | |
| GSE46452 | UCP1 | 7350 | 1 | 36 | 22 | |
| GSE47630 | UCP1 | 7350 | 0 | 22 | 18 | |
| GSE54993 | UCP1 | 7350 | 10 | 0 | 60 | |
| GSE54994 | UCP1 | 7350 | 2 | 11 | 40 | |
| GSE60625 | UCP1 | 7350 | 0 | 1 | 10 | |
| GSE74703 | UCP1 | 7350 | 0 | 11 | 25 | |
| GSE74704 | UCP1 | 7350 | 0 | 6 | 14 | |
| TCGA | UCP1 | 7350 | 12 | 31 | 53 |
Total number of gains: 25; Total number of losses: 155; Total Number of normals: 308.
Somatic mutations of UCP1:
Generating mutation plots.
Highly correlated genes for UCP1:
Showing top 20/907 corelated genes with mean PCC>0.5.
| Gene1 | Gene2 | Mean PCC | Num. Datasets | Num. PCC<0 | Num. PCC>0.5 |
|---|---|---|---|---|---|
| UCP1 | SPATA24 | 0.722616 | 3 | 0 | 3 |
| UCP1 | KCNK17 | 0.705871 | 4 | 0 | 4 |
| UCP1 | HPX | 0.688343 | 6 | 0 | 6 |
| UCP1 | GBF1 | 0.668673 | 3 | 0 | 3 |
| UCP1 | PTCRA | 0.664083 | 5 | 0 | 4 |
| UCP1 | HSD3B1 | 0.663675 | 4 | 0 | 4 |
| UCP1 | STAC2 | 0.662429 | 3 | 0 | 3 |
| UCP1 | CAMKV | 0.661494 | 7 | 0 | 7 |
| UCP1 | C2orf72 | 0.659991 | 8 | 0 | 8 |
| UCP1 | APBA1 | 0.655462 | 6 | 0 | 5 |
| UCP1 | MMP25 | 0.652785 | 5 | 0 | 5 |
| UCP1 | C6orf223 | 0.651974 | 3 | 0 | 3 |
| UCP1 | CCDC70 | 0.651893 | 6 | 0 | 5 |
| UCP1 | PRB1 | 0.650232 | 7 | 0 | 7 |
| UCP1 | PSG1 | 0.647847 | 7 | 0 | 6 |
| UCP1 | NRGN | 0.647487 | 5 | 0 | 4 |
| UCP1 | EPOR | 0.647111 | 7 | 0 | 6 |
| UCP1 | EDA2R | 0.643264 | 7 | 0 | 5 |
| UCP1 | AMHR2 | 0.643102 | 6 | 0 | 5 |
| UCP1 | FSTL4 | 0.642596 | 6 | 0 | 5 |
For details and further investigation, click here