| Full name: amyloid beta precursor protein binding family A member 1 | Alias Symbol: D9S411E|X11 | ||
| Type: protein-coding gene | Cytoband: 9q21.12 | ||
| Entrez ID: 320 | HGNC ID: HGNC:578 | Ensembl Gene: ENSG00000107282 | OMIM ID: 602414 |
Expression of APBA1:
| Dataset | Gene | EntrezID | Probe | Log2FC | Adj.pValue | Expression |
|---|---|---|---|---|---|---|
| GSE17351 | APBA1 | 320 | 206679_at | -0.1388 | 0.6528 | |
| GSE20347 | APBA1 | 320 | 206679_at | -0.0277 | 0.7366 | |
| GSE23400 | APBA1 | 320 | 206679_at | -0.0855 | 0.0065 | |
| GSE26886 | APBA1 | 320 | 206679_at | 0.1355 | 0.2279 | |
| GSE29001 | APBA1 | 320 | 206679_at | -0.3416 | 0.0480 | |
| GSE38129 | APBA1 | 320 | 206679_at | -0.1476 | 0.1094 | |
| GSE45670 | APBA1 | 320 | 206679_at | 0.0695 | 0.4562 | |
| GSE53622 | APBA1 | 320 | 17618 | -0.5972 | 0.0003 | |
| GSE53624 | APBA1 | 320 | 17618 | -0.1682 | 0.2003 | |
| GSE63941 | APBA1 | 320 | 228101_at | -1.1105 | 0.0691 | |
| GSE77861 | APBA1 | 320 | 206679_at | 0.0661 | 0.4304 | |
| GSE97050 | APBA1 | 320 | A_33_P3295650 | -0.2895 | 0.4464 | |
| SRP007169 | APBA1 | 320 | RNAseq | 0.4964 | 0.4397 | |
| SRP008496 | APBA1 | 320 | RNAseq | 1.1149 | 0.0269 | |
| SRP064894 | APBA1 | 320 | RNAseq | -0.0744 | 0.7370 | |
| SRP133303 | APBA1 | 320 | RNAseq | -0.5160 | 0.0197 | |
| SRP159526 | APBA1 | 320 | RNAseq | 1.1351 | 0.1127 | |
| SRP193095 | APBA1 | 320 | RNAseq | 0.3805 | 0.0520 | |
| SRP219564 | APBA1 | 320 | RNAseq | -0.1931 | 0.7262 | |
| TCGA | APBA1 | 320 | RNAseq | -0.2711 | 0.0288 |
Upregulated datasets: 1; Downregulated datasets: 0.
Survival by APBA1 expression:
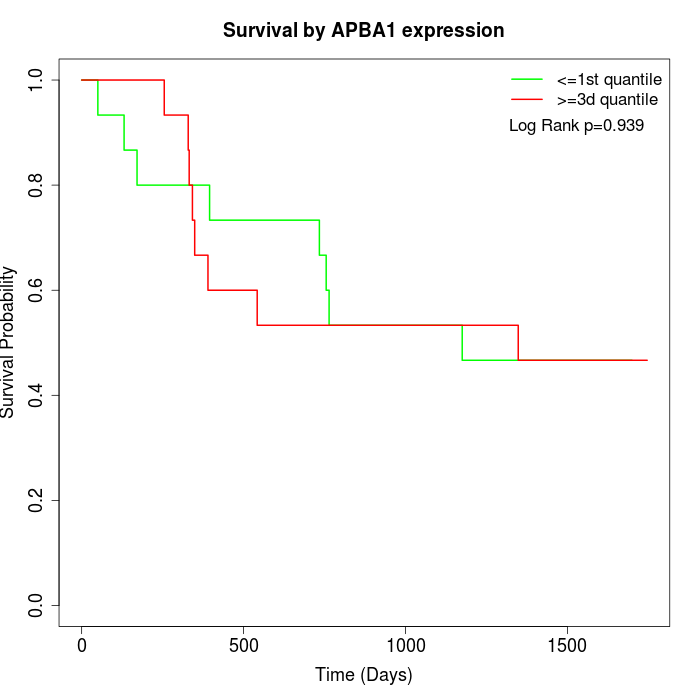 | 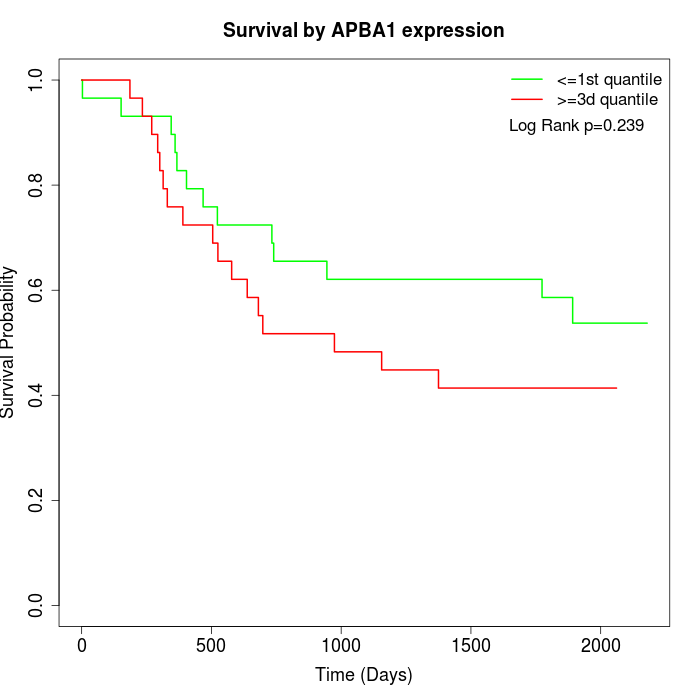 | 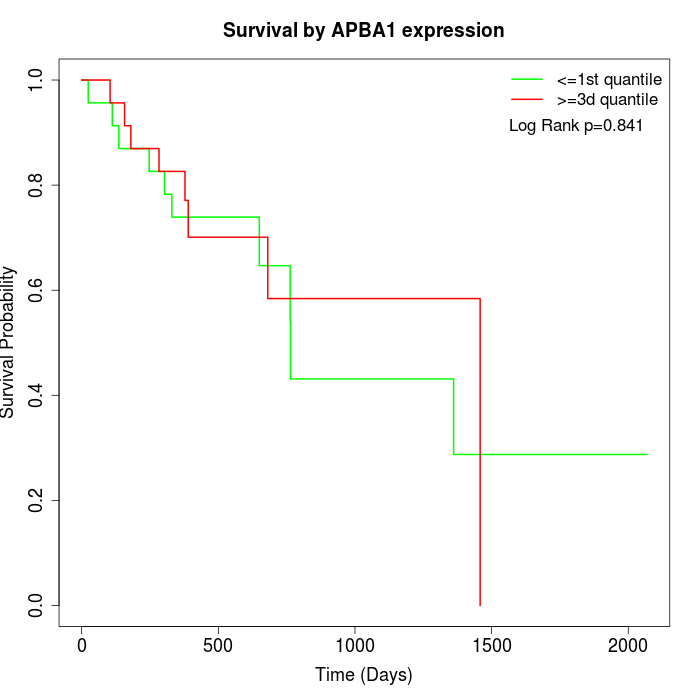 |
| GSE53622 | GSE53624 | TCGA |
Note: Click image to view full size file.
Copy number change of APBA1:
| Dataset | Gene | EntrezID | Gain | Loss | Normal | Detail |
|---|---|---|---|---|---|---|
| GSE15526 | APBA1 | 320 | 6 | 10 | 14 | |
| GSE20123 | APBA1 | 320 | 6 | 10 | 14 | |
| GSE43470 | APBA1 | 320 | 6 | 5 | 32 | |
| GSE46452 | APBA1 | 320 | 7 | 14 | 38 | |
| GSE47630 | APBA1 | 320 | 1 | 19 | 20 | |
| GSE54993 | APBA1 | 320 | 5 | 1 | 64 | |
| GSE54994 | APBA1 | 320 | 4 | 13 | 36 | |
| GSE60625 | APBA1 | 320 | 0 | 0 | 11 | |
| GSE74703 | APBA1 | 320 | 5 | 4 | 27 | |
| GSE74704 | APBA1 | 320 | 3 | 7 | 10 | |
| TCGA | APBA1 | 320 | 19 | 28 | 49 |
Total number of gains: 62; Total number of losses: 111; Total Number of normals: 315.
Somatic mutations of APBA1:
Generating mutation plots.
Highly correlated genes for APBA1:
Showing top 20/689 corelated genes with mean PCC>0.5.
| Gene1 | Gene2 | Mean PCC | Num. Datasets | Num. PCC<0 | Num. PCC>0.5 |
|---|---|---|---|---|---|
| APBA1 | PDK2 | 0.763252 | 3 | 0 | 3 |
| APBA1 | ZNF358 | 0.734608 | 3 | 0 | 3 |
| APBA1 | HK1 | 0.731702 | 3 | 0 | 3 |
| APBA1 | SH3BP2 | 0.727943 | 4 | 0 | 4 |
| APBA1 | UMOD | 0.727141 | 5 | 0 | 5 |
| APBA1 | RAP2A | 0.725594 | 3 | 0 | 3 |
| APBA1 | SCN10A | 0.724683 | 3 | 0 | 3 |
| APBA1 | PLEKHA5 | 0.723724 | 3 | 0 | 3 |
| APBA1 | DNAH11 | 0.723579 | 3 | 0 | 3 |
| APBA1 | NHSL2 | 0.719218 | 3 | 0 | 3 |
| APBA1 | BRINP2 | 0.709395 | 4 | 0 | 4 |
| APBA1 | KCNQ1DN | 0.70573 | 7 | 0 | 7 |
| APBA1 | GPR31 | 0.703602 | 6 | 0 | 6 |
| APBA1 | GABRR2 | 0.694911 | 7 | 0 | 6 |
| APBA1 | PRTN3 | 0.692866 | 4 | 0 | 4 |
| APBA1 | MSH4 | 0.690542 | 3 | 0 | 3 |
| APBA1 | IFFO2 | 0.688538 | 3 | 0 | 3 |
| APBA1 | SAMD4B | 0.688079 | 5 | 0 | 4 |
| APBA1 | IL25 | 0.68656 | 5 | 0 | 4 |
| APBA1 | ESR2 | 0.684769 | 5 | 0 | 4 |
For details and further investigation, click here