| Full name: unc-13 homolog B | Alias Symbol: hmunc13|Unc13h2|Munc13-2 | ||
| Type: protein-coding gene | Cytoband: 9p13.3 | ||
| Entrez ID: 10497 | HGNC ID: HGNC:12566 | Ensembl Gene: ENSG00000198722 | OMIM ID: 605836 |
Expression of UNC13B:
| Dataset | Gene | EntrezID | Probe | Log2FC | Adj.pValue | Expression |
|---|---|---|---|---|---|---|
| GSE17351 | UNC13B | 10497 | 202893_at | -0.8116 | 0.0674 | |
| GSE20347 | UNC13B | 10497 | 202893_at | -1.3731 | 0.0000 | |
| GSE23400 | UNC13B | 10497 | 202893_at | -0.8224 | 0.0000 | |
| GSE26886 | UNC13B | 10497 | 202893_at | -1.5939 | 0.0000 | |
| GSE29001 | UNC13B | 10497 | 202893_at | -1.0439 | 0.0025 | |
| GSE38129 | UNC13B | 10497 | 202893_at | -1.1688 | 0.0000 | |
| GSE45670 | UNC13B | 10497 | 202893_at | -0.4073 | 0.1041 | |
| GSE53622 | UNC13B | 10497 | 159092 | -0.8038 | 0.0000 | |
| GSE53624 | UNC13B | 10497 | 159092 | -0.9901 | 0.0000 | |
| GSE63941 | UNC13B | 10497 | 202893_at | -1.2391 | 0.0315 | |
| GSE77861 | UNC13B | 10497 | 202893_at | -1.1030 | 0.0127 | |
| GSE97050 | UNC13B | 10497 | A_23_P253395 | -0.3821 | 0.4075 | |
| SRP007169 | UNC13B | 10497 | RNAseq | -0.8776 | 0.1076 | |
| SRP008496 | UNC13B | 10497 | RNAseq | -0.7707 | 0.0385 | |
| SRP064894 | UNC13B | 10497 | RNAseq | -0.9463 | 0.0000 | |
| SRP133303 | UNC13B | 10497 | RNAseq | -1.1816 | 0.0000 | |
| SRP159526 | UNC13B | 10497 | RNAseq | -1.6037 | 0.0000 | |
| SRP193095 | UNC13B | 10497 | RNAseq | -1.3035 | 0.0000 | |
| SRP219564 | UNC13B | 10497 | RNAseq | -0.6599 | 0.0957 | |
| TCGA | UNC13B | 10497 | RNAseq | -0.5418 | 0.0000 |
Upregulated datasets: 0; Downregulated datasets: 9.
Survival by UNC13B expression:
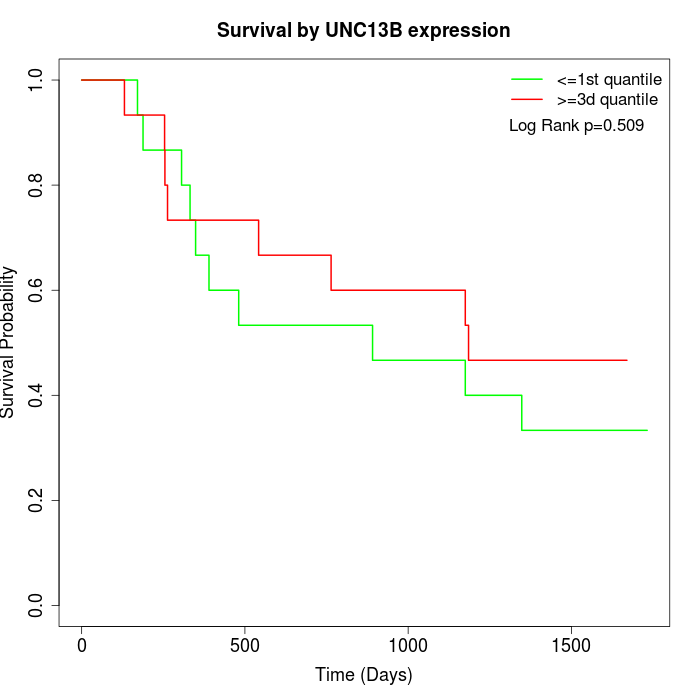 |  | 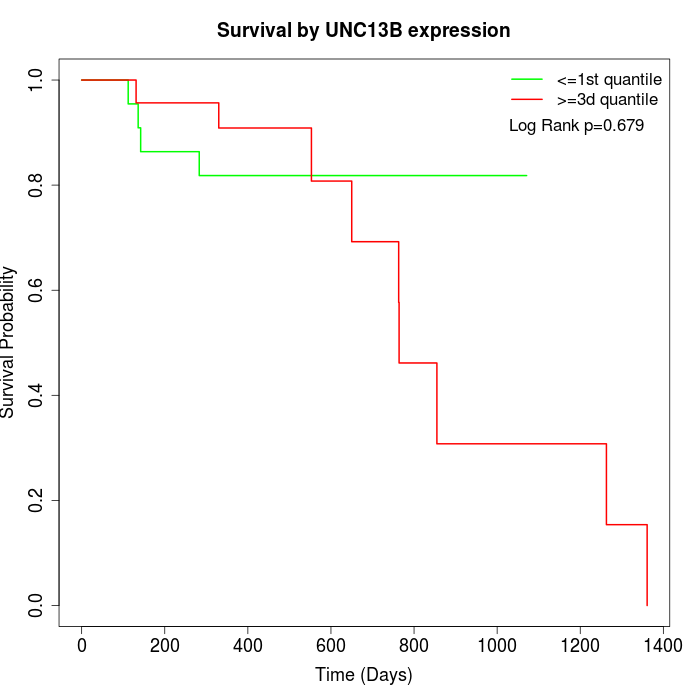 |
| GSE53622 | GSE53624 | TCGA |
Note: Click image to view full size file.
Copy number change of UNC13B:
| Dataset | Gene | EntrezID | Gain | Loss | Normal | Detail |
|---|---|---|---|---|---|---|
| GSE15526 | UNC13B | 10497 | 3 | 12 | 15 | |
| GSE20123 | UNC13B | 10497 | 3 | 12 | 15 | |
| GSE43470 | UNC13B | 10497 | 3 | 10 | 30 | |
| GSE46452 | UNC13B | 10497 | 6 | 15 | 38 | |
| GSE47630 | UNC13B | 10497 | 1 | 20 | 19 | |
| GSE54993 | UNC13B | 10497 | 6 | 0 | 64 | |
| GSE54994 | UNC13B | 10497 | 6 | 12 | 35 | |
| GSE60625 | UNC13B | 10497 | 0 | 0 | 11 | |
| GSE74703 | UNC13B | 10497 | 2 | 7 | 27 | |
| GSE74704 | UNC13B | 10497 | 0 | 10 | 10 | |
| TCGA | UNC13B | 10497 | 16 | 44 | 36 |
Total number of gains: 46; Total number of losses: 142; Total Number of normals: 300.
Somatic mutations of UNC13B:
Generating mutation plots.
Highly correlated genes for UNC13B:
Showing top 20/1129 corelated genes with mean PCC>0.5.
| Gene1 | Gene2 | Mean PCC | Num. Datasets | Num. PCC<0 | Num. PCC>0.5 |
|---|---|---|---|---|---|
| UNC13B | SPNS2 | 0.831557 | 4 | 0 | 4 |
| UNC13B | VSIG10L | 0.804218 | 6 | 0 | 6 |
| UNC13B | SNORA68 | 0.799275 | 4 | 0 | 4 |
| UNC13B | CYSRT1 | 0.790812 | 6 | 0 | 6 |
| UNC13B | MAL | 0.784564 | 10 | 0 | 10 |
| UNC13B | EPS8L2 | 0.784268 | 10 | 0 | 10 |
| UNC13B | SFTA2 | 0.781143 | 4 | 0 | 4 |
| UNC13B | SMIM5 | 0.779367 | 6 | 0 | 6 |
| UNC13B | TTC9 | 0.778224 | 10 | 0 | 10 |
| UNC13B | DEGS2 | 0.776174 | 6 | 0 | 6 |
| UNC13B | SCNN1B | 0.776067 | 10 | 0 | 10 |
| UNC13B | GDPD3 | 0.775784 | 10 | 0 | 10 |
| UNC13B | PCBP1-AS1 | 0.771734 | 3 | 0 | 3 |
| UNC13B | SASH1 | 0.765109 | 11 | 0 | 10 |
| UNC13B | CHP1 | 0.764295 | 10 | 0 | 10 |
| UNC13B | MGLL | 0.763223 | 11 | 0 | 11 |
| UNC13B | CEACAM7 | 0.761804 | 10 | 0 | 10 |
| UNC13B | RANBP9 | 0.75865 | 10 | 0 | 10 |
| UNC13B | PRSS2 | 0.7575 | 8 | 0 | 8 |
| UNC13B | HOPX | 0.754068 | 10 | 0 | 10 |
For details and further investigation, click here