| Full name: UTP18 small subunit processome component | Alias Symbol: CGI-48 | ||
| Type: protein-coding gene | Cytoband: 17q21.33 | ||
| Entrez ID: 51096 | HGNC ID: HGNC:24274 | Ensembl Gene: ENSG00000011260 | OMIM ID: 612816 |
Screen Evidence:
| |||
Expression of UTP18:
| Dataset | Gene | EntrezID | Probe | Log2FC | Adj.pValue | Expression |
|---|---|---|---|---|---|---|
| GSE17351 | UTP18 | 51096 | 203721_s_at | 0.3888 | 0.2342 | |
| GSE20347 | UTP18 | 51096 | 203721_s_at | 0.3448 | 0.0595 | |
| GSE23400 | UTP18 | 51096 | 203721_s_at | 0.7650 | 0.0000 | |
| GSE26886 | UTP18 | 51096 | 203721_s_at | 0.3043 | 0.0573 | |
| GSE29001 | UTP18 | 51096 | 203721_s_at | 0.4222 | 0.2699 | |
| GSE38129 | UTP18 | 51096 | 203721_s_at | 0.6522 | 0.0000 | |
| GSE45670 | UTP18 | 51096 | 203721_s_at | 0.0577 | 0.8019 | |
| GSE53622 | UTP18 | 51096 | 75367 | 0.4246 | 0.0000 | |
| GSE53624 | UTP18 | 51096 | 75367 | 0.4492 | 0.0000 | |
| GSE63941 | UTP18 | 51096 | 203721_s_at | 0.7700 | 0.0024 | |
| GSE77861 | UTP18 | 51096 | 203721_s_at | 0.6216 | 0.0106 | |
| GSE97050 | UTP18 | 51096 | A_23_P130020 | 0.5543 | 0.2575 | |
| SRP007169 | UTP18 | 51096 | RNAseq | 1.4866 | 0.0011 | |
| SRP008496 | UTP18 | 51096 | RNAseq | 1.1713 | 0.0002 | |
| SRP064894 | UTP18 | 51096 | RNAseq | 0.3022 | 0.0601 | |
| SRP133303 | UTP18 | 51096 | RNAseq | 0.4456 | 0.0244 | |
| SRP159526 | UTP18 | 51096 | RNAseq | 0.3467 | 0.2080 | |
| SRP193095 | UTP18 | 51096 | RNAseq | 0.0049 | 0.9627 | |
| SRP219564 | UTP18 | 51096 | RNAseq | 0.2231 | 0.5562 | |
| TCGA | UTP18 | 51096 | RNAseq | 0.2499 | 0.0000 |
Upregulated datasets: 2; Downregulated datasets: 0.
Survival by UTP18 expression:
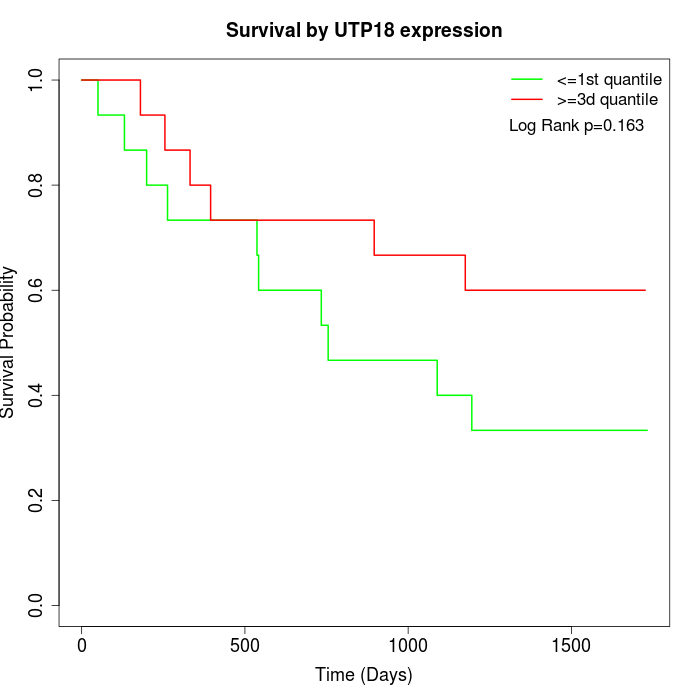 | 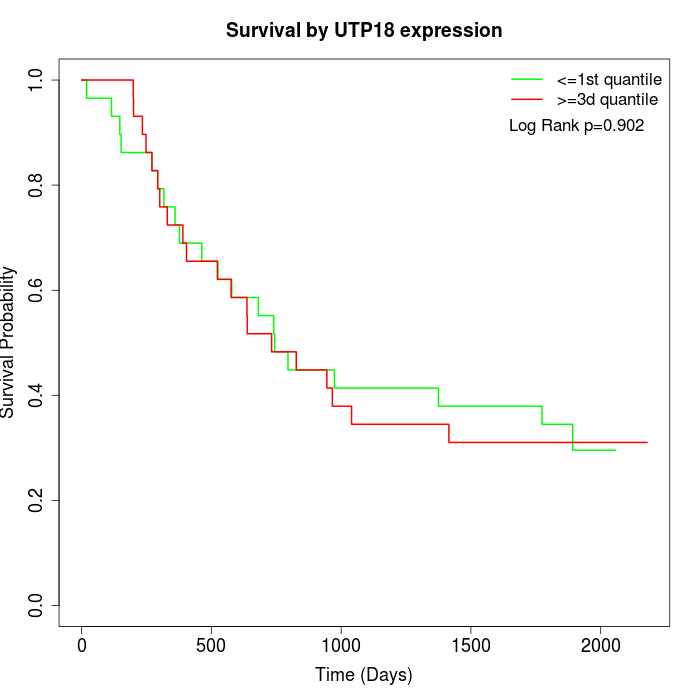 |  |
| GSE53622 | GSE53624 | TCGA |
Note: Click image to view full size file.
Copy number change of UTP18:
| Dataset | Gene | EntrezID | Gain | Loss | Normal | Detail |
|---|---|---|---|---|---|---|
| GSE15526 | UTP18 | 51096 | 5 | 2 | 23 | |
| GSE20123 | UTP18 | 51096 | 5 | 2 | 23 | |
| GSE43470 | UTP18 | 51096 | 2 | 2 | 39 | |
| GSE46452 | UTP18 | 51096 | 32 | 0 | 27 | |
| GSE47630 | UTP18 | 51096 | 9 | 0 | 31 | |
| GSE54993 | UTP18 | 51096 | 2 | 4 | 64 | |
| GSE54994 | UTP18 | 51096 | 8 | 6 | 39 | |
| GSE60625 | UTP18 | 51096 | 4 | 0 | 7 | |
| GSE74703 | UTP18 | 51096 | 2 | 2 | 32 | |
| GSE74704 | UTP18 | 51096 | 4 | 1 | 15 | |
| TCGA | UTP18 | 51096 | 26 | 8 | 62 |
Total number of gains: 99; Total number of losses: 27; Total Number of normals: 362.
Somatic mutations of UTP18:
Generating mutation plots.
Highly correlated genes for UTP18:
Showing top 20/1244 corelated genes with mean PCC>0.5.
| Gene1 | Gene2 | Mean PCC | Num. Datasets | Num. PCC<0 | Num. PCC>0.5 |
|---|---|---|---|---|---|
| UTP18 | FAM110A | 0.740833 | 3 | 0 | 3 |
| UTP18 | NME1 | 0.716399 | 12 | 0 | 10 |
| UTP18 | UCK2 | 0.71015 | 3 | 0 | 3 |
| UTP18 | BRI3BP | 0.703968 | 3 | 0 | 3 |
| UTP18 | LRRC59 | 0.694734 | 10 | 0 | 8 |
| UTP18 | CCNB1 | 0.690978 | 10 | 0 | 8 |
| UTP18 | PBK | 0.682469 | 11 | 0 | 9 |
| UTP18 | BUB1B | 0.678691 | 7 | 0 | 7 |
| UTP18 | PRKDC | 0.678084 | 10 | 0 | 9 |
| UTP18 | BAIAP2L1 | 0.674601 | 4 | 0 | 4 |
| UTP18 | DTYMK | 0.673019 | 8 | 0 | 8 |
| UTP18 | NXT2 | 0.669545 | 9 | 0 | 8 |
| UTP18 | CDCA2 | 0.666406 | 4 | 0 | 3 |
| UTP18 | RAN | 0.666052 | 12 | 0 | 10 |
| UTP18 | ILF2 | 0.665792 | 12 | 0 | 10 |
| UTP18 | SMC6 | 0.663923 | 8 | 0 | 7 |
| UTP18 | NOL11 | 0.6636 | 12 | 0 | 10 |
| UTP18 | PSMB3 | 0.663493 | 9 | 0 | 8 |
| UTP18 | FANCB | 0.662967 | 4 | 0 | 3 |
| UTP18 | GART | 0.662753 | 9 | 0 | 8 |
For details and further investigation, click here