| Full name: phosphoribosylglycinamide formyltransferase, phosphoribosylglycinamide synthetase, phosphoribosylaminoimidazole synthetase | Alias Symbol: GARS-AIRS-GART | ||
| Type: protein-coding gene | Cytoband: 21q22.11 | ||
| Entrez ID: 2618 | HGNC ID: HGNC:4163 | Ensembl Gene: ENSG00000159131 | OMIM ID: 138440 |
| Related drugs: PEMETREXED (CHEMBL1201258), PEMETREXED DISODIUM... [more] | |||
Screen Evidence:
| |||
Expression of GART:
| Dataset | Gene | EntrezID | Probe | Log2FC | Adj.pValue | Expression |
|---|---|---|---|---|---|---|
| GSE17351 | GART | 2618 | 212378_at | 0.9504 | 0.0432 | |
| GSE20347 | GART | 2618 | 212378_at | 0.6602 | 0.0007 | |
| GSE23400 | GART | 2618 | 212378_at | 0.7435 | 0.0000 | |
| GSE26886 | GART | 2618 | 212378_at | -0.1203 | 0.5984 | |
| GSE29001 | GART | 2618 | 212378_at | 0.7986 | 0.0102 | |
| GSE38129 | GART | 2618 | 212378_at | 0.8877 | 0.0000 | |
| GSE45670 | GART | 2618 | 212378_at | 0.7379 | 0.0000 | |
| GSE53622 | GART | 2618 | 103884 | 0.5290 | 0.0000 | |
| GSE53624 | GART | 2618 | 103884 | 0.7651 | 0.0000 | |
| GSE63941 | GART | 2618 | 212378_at | 1.3290 | 0.0140 | |
| GSE77861 | GART | 2618 | 212379_at | 0.1188 | 0.4623 | |
| GSE97050 | GART | 2618 | A_23_P80098 | 0.5708 | 0.2242 | |
| SRP007169 | GART | 2618 | RNAseq | 1.0170 | 0.0294 | |
| SRP008496 | GART | 2618 | RNAseq | 1.0267 | 0.0002 | |
| SRP064894 | GART | 2618 | RNAseq | 0.6787 | 0.0013 | |
| SRP133303 | GART | 2618 | RNAseq | 0.2510 | 0.0747 | |
| SRP159526 | GART | 2618 | RNAseq | 0.3228 | 0.2059 | |
| SRP193095 | GART | 2618 | RNAseq | 0.2714 | 0.0022 | |
| SRP219564 | GART | 2618 | RNAseq | 0.1526 | 0.6682 | |
| TCGA | GART | 2618 | RNAseq | 0.1618 | 0.0009 |
Upregulated datasets: 3; Downregulated datasets: 0.
Survival by GART expression:
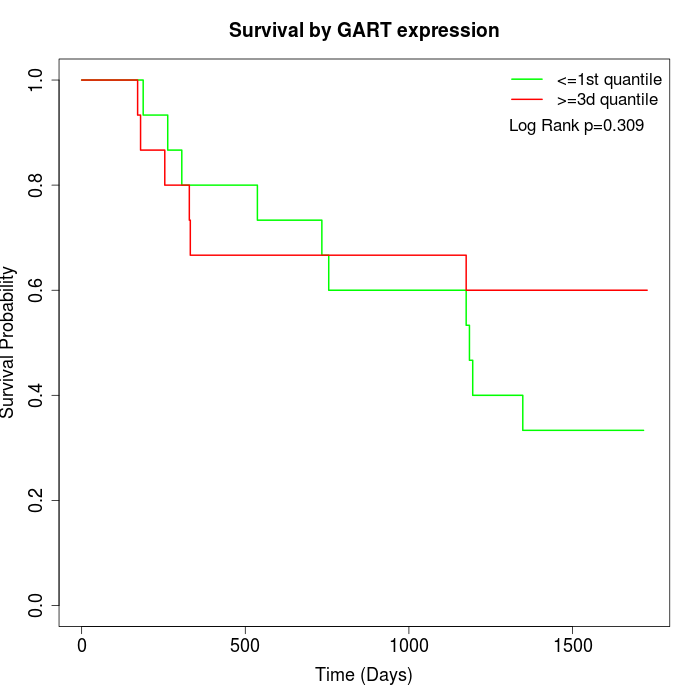 | 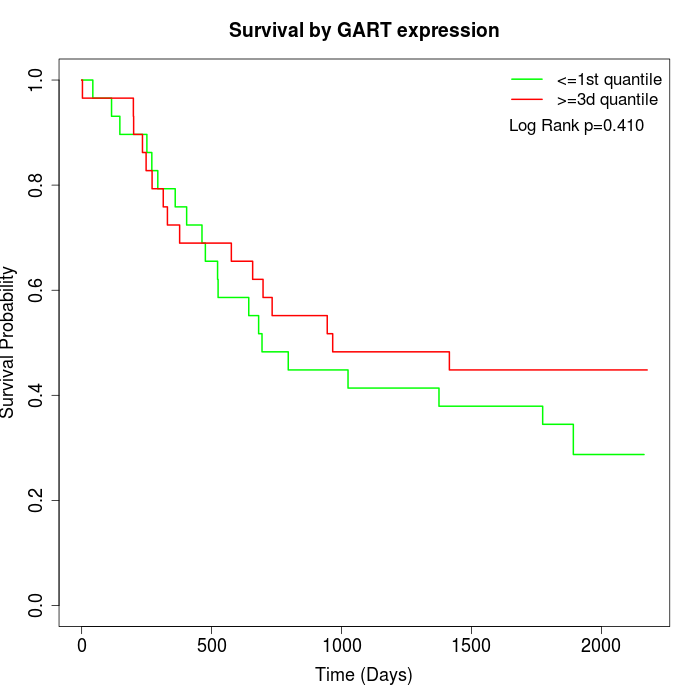 | 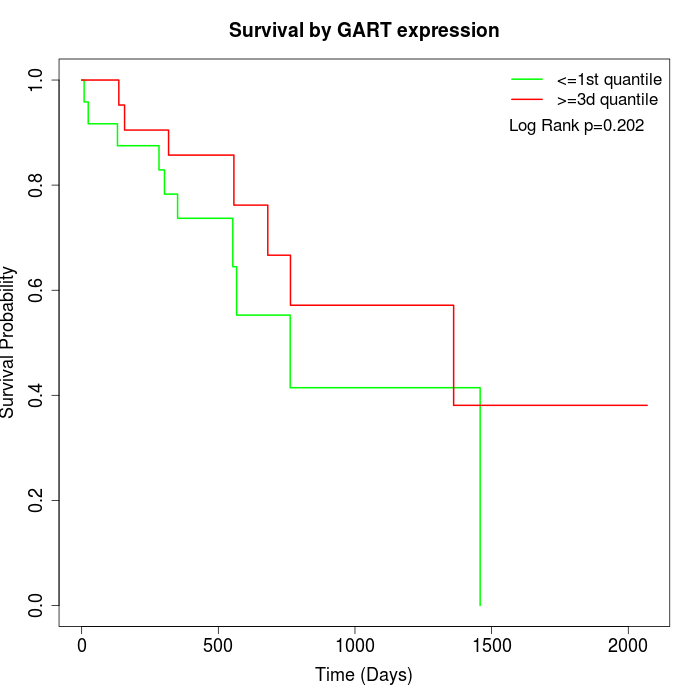 |
| GSE53622 | GSE53624 | TCGA |
Note: Click image to view full size file.
Copy number change of GART:
| Dataset | Gene | EntrezID | Gain | Loss | Normal | Detail |
|---|---|---|---|---|---|---|
| GSE15526 | GART | 2618 | 2 | 8 | 20 | |
| GSE20123 | GART | 2618 | 2 | 9 | 19 | |
| GSE43470 | GART | 2618 | 3 | 9 | 31 | |
| GSE46452 | GART | 2618 | 1 | 21 | 37 | |
| GSE47630 | GART | 2618 | 6 | 17 | 17 | |
| GSE54993 | GART | 2618 | 9 | 1 | 60 | |
| GSE54994 | GART | 2618 | 1 | 9 | 43 | |
| GSE60625 | GART | 2618 | 0 | 0 | 11 | |
| GSE74703 | GART | 2618 | 3 | 6 | 27 | |
| GSE74704 | GART | 2618 | 1 | 4 | 15 | |
| TCGA | GART | 2618 | 9 | 35 | 52 |
Total number of gains: 37; Total number of losses: 119; Total Number of normals: 332.
Somatic mutations of GART:
Generating mutation plots.
Highly correlated genes for GART:
Showing top 20/1723 corelated genes with mean PCC>0.5.
| Gene1 | Gene2 | Mean PCC | Num. Datasets | Num. PCC<0 | Num. PCC>0.5 |
|---|---|---|---|---|---|
| GART | PPP1R9B | 0.828145 | 3 | 0 | 3 |
| GART | CENPE | 0.76014 | 9 | 0 | 9 |
| GART | RRP36 | 0.752361 | 5 | 0 | 5 |
| GART | CPSF6 | 0.748965 | 9 | 0 | 9 |
| GART | TSPAN17 | 0.748423 | 4 | 0 | 4 |
| GART | PRKDC | 0.748362 | 10 | 0 | 9 |
| GART | SHCBP1 | 0.742252 | 10 | 0 | 10 |
| GART | CCNA2 | 0.741459 | 9 | 0 | 9 |
| GART | DEPDC1 | 0.739851 | 10 | 0 | 10 |
| GART | GPR153 | 0.737507 | 3 | 0 | 3 |
| GART | CDC20 | 0.736108 | 10 | 0 | 10 |
| GART | EME1 | 0.733315 | 4 | 0 | 3 |
| GART | MRPL42 | 0.732201 | 8 | 0 | 8 |
| GART | TTK | 0.731678 | 10 | 0 | 10 |
| GART | DHX33 | 0.730591 | 6 | 0 | 6 |
| GART | CMIP | 0.728442 | 5 | 0 | 5 |
| GART | RHBDF2 | 0.728391 | 5 | 0 | 5 |
| GART | ATAD2 | 0.726514 | 11 | 0 | 10 |
| GART | HEATR1 | 0.725847 | 10 | 0 | 10 |
| GART | DONSON | 0.725441 | 13 | 0 | 11 |
For details and further investigation, click here