| Full name: UTP20 small subunit processome component | Alias Symbol: DRIM|1A6/DRIM | ||
| Type: protein-coding gene | Cytoband: 12q23.2 | ||
| Entrez ID: 27340 | HGNC ID: HGNC:17897 | Ensembl Gene: ENSG00000120800 | OMIM ID: 612822 |
Screen Evidence:
| |||
Expression of UTP20:
| Dataset | Gene | EntrezID | Probe | Log2FC | Adj.pValue | Expression |
|---|---|---|---|---|---|---|
| GSE17351 | UTP20 | 27340 | 209725_at | 0.6956 | 0.0913 | |
| GSE20347 | UTP20 | 27340 | 209725_at | 0.1964 | 0.1898 | |
| GSE23400 | UTP20 | 27340 | 209725_at | 0.1873 | 0.0000 | |
| GSE26886 | UTP20 | 27340 | 209725_at | 0.2559 | 0.2022 | |
| GSE29001 | UTP20 | 27340 | 209725_at | 0.3341 | 0.5620 | |
| GSE38129 | UTP20 | 27340 | 209725_at | 0.5265 | 0.0125 | |
| GSE45670 | UTP20 | 27340 | 209725_at | 0.4292 | 0.0032 | |
| GSE53622 | UTP20 | 27340 | 109166 | 0.5251 | 0.0000 | |
| GSE53624 | UTP20 | 27340 | 109166 | 0.7792 | 0.0000 | |
| GSE63941 | UTP20 | 27340 | 209725_at | -1.0324 | 0.0344 | |
| GSE77861 | UTP20 | 27340 | 209725_at | 0.4208 | 0.0073 | |
| GSE97050 | UTP20 | 27340 | A_23_P162525 | 0.3948 | 0.1460 | |
| SRP007169 | UTP20 | 27340 | RNAseq | 1.9052 | 0.0002 | |
| SRP008496 | UTP20 | 27340 | RNAseq | 2.0146 | 0.0000 | |
| SRP064894 | UTP20 | 27340 | RNAseq | 0.1786 | 0.3830 | |
| SRP133303 | UTP20 | 27340 | RNAseq | 0.6355 | 0.0015 | |
| SRP159526 | UTP20 | 27340 | RNAseq | 0.3490 | 0.1605 | |
| SRP193095 | UTP20 | 27340 | RNAseq | 0.3335 | 0.0002 | |
| SRP219564 | UTP20 | 27340 | RNAseq | -0.0107 | 0.9620 | |
| TCGA | UTP20 | 27340 | RNAseq | 0.1282 | 0.0281 |
Upregulated datasets: 2; Downregulated datasets: 1.
Survival by UTP20 expression:
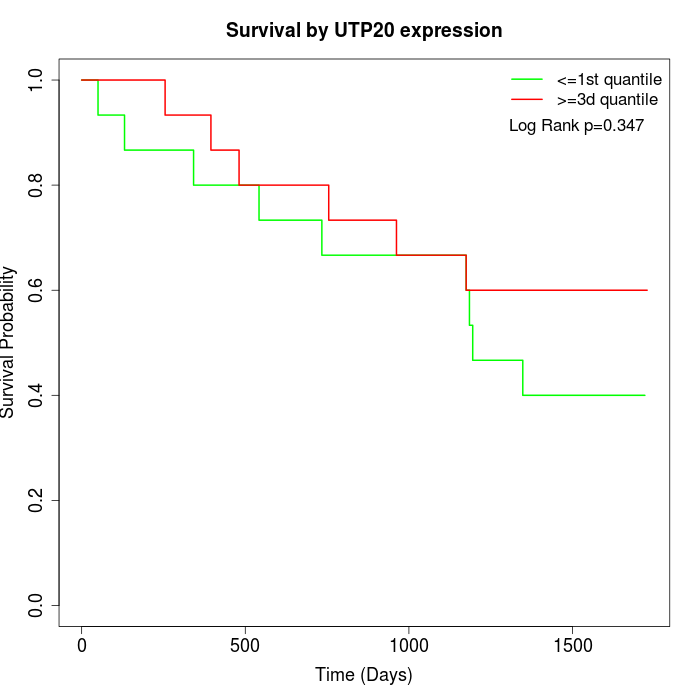 | 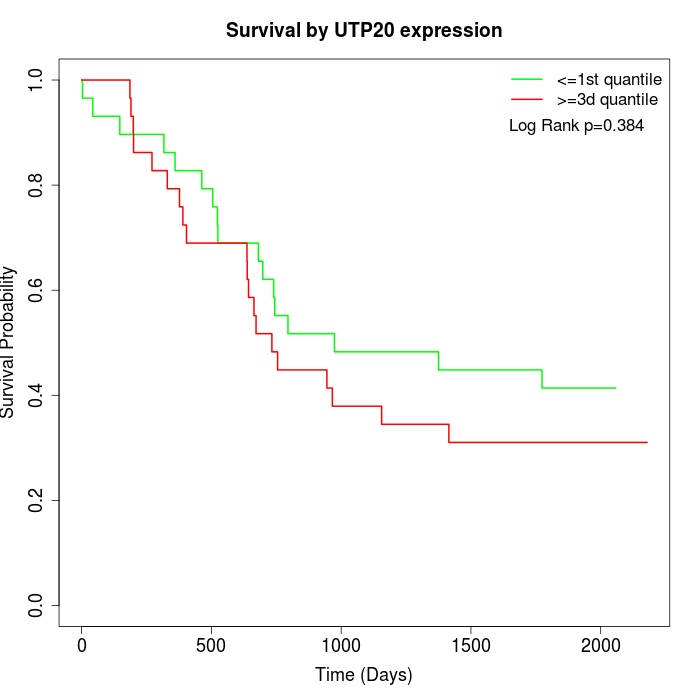 | 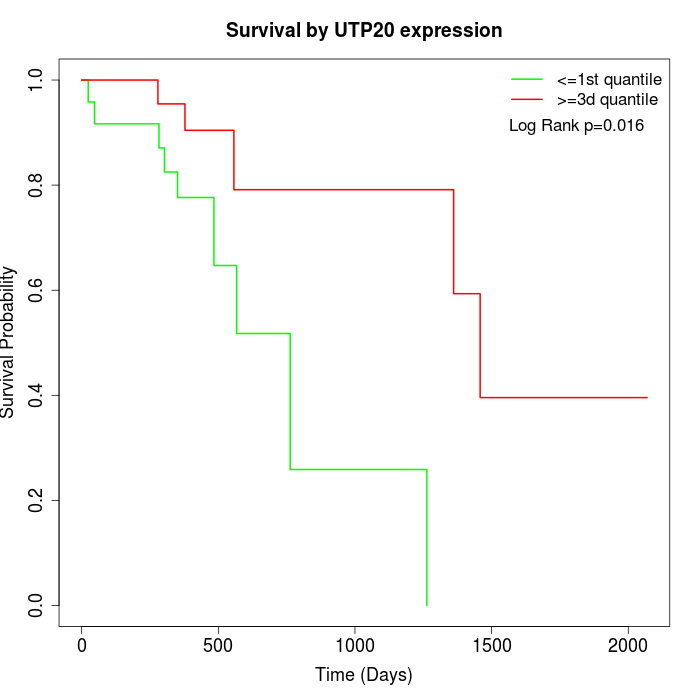 |
| GSE53622 | GSE53624 | TCGA |
Note: Click image to view full size file.
Copy number change of UTP20:
| Dataset | Gene | EntrezID | Gain | Loss | Normal | Detail |
|---|---|---|---|---|---|---|
| GSE15526 | UTP20 | 27340 | 2 | 2 | 26 | |
| GSE20123 | UTP20 | 27340 | 2 | 2 | 26 | |
| GSE43470 | UTP20 | 27340 | 2 | 0 | 41 | |
| GSE46452 | UTP20 | 27340 | 9 | 1 | 49 | |
| GSE47630 | UTP20 | 27340 | 9 | 1 | 30 | |
| GSE54993 | UTP20 | 27340 | 0 | 5 | 65 | |
| GSE54994 | UTP20 | 27340 | 4 | 2 | 47 | |
| GSE60625 | UTP20 | 27340 | 0 | 0 | 11 | |
| GSE74703 | UTP20 | 27340 | 2 | 0 | 34 | |
| GSE74704 | UTP20 | 27340 | 1 | 2 | 17 | |
| TCGA | UTP20 | 27340 | 19 | 10 | 67 |
Total number of gains: 50; Total number of losses: 25; Total Number of normals: 413.
Somatic mutations of UTP20:
Generating mutation plots.
Highly correlated genes for UTP20:
Showing top 20/988 corelated genes with mean PCC>0.5.
| Gene1 | Gene2 | Mean PCC | Num. Datasets | Num. PCC<0 | Num. PCC>0.5 |
|---|---|---|---|---|---|
| UTP20 | SPSB2 | 0.815468 | 3 | 0 | 3 |
| UTP20 | TMEM63B | 0.797142 | 3 | 0 | 3 |
| UTP20 | FIP1L1 | 0.781924 | 3 | 0 | 3 |
| UTP20 | METAP1D | 0.778703 | 3 | 0 | 3 |
| UTP20 | XAB2 | 0.764507 | 3 | 0 | 3 |
| UTP20 | SPATA5 | 0.75381 | 3 | 0 | 3 |
| UTP20 | CDCA2 | 0.74043 | 4 | 0 | 4 |
| UTP20 | RIOK1 | 0.740265 | 6 | 0 | 6 |
| UTP20 | CDC42EP4 | 0.740078 | 3 | 0 | 3 |
| UTP20 | PLEKHA3 | 0.738117 | 3 | 0 | 3 |
| UTP20 | DDX55 | 0.732501 | 6 | 0 | 6 |
| UTP20 | ANKRD11 | 0.731484 | 3 | 0 | 3 |
| UTP20 | ZBTB9 | 0.730848 | 5 | 0 | 5 |
| UTP20 | ZXDC | 0.729833 | 4 | 0 | 4 |
| UTP20 | CCDC117 | 0.725845 | 3 | 0 | 3 |
| UTP20 | PIGM | 0.72529 | 3 | 0 | 3 |
| UTP20 | KBTBD6 | 0.723073 | 4 | 0 | 4 |
| UTP20 | ZCCHC3 | 0.722167 | 3 | 0 | 3 |
| UTP20 | WDR70 | 0.718247 | 3 | 0 | 3 |
| UTP20 | SASS6 | 0.714735 | 4 | 0 | 4 |
For details and further investigation, click here