| Full name: V-set and immunoglobulin domain containing 10 | Alias Symbol: | ||
| Type: protein-coding gene | Cytoband: 12q24.23 | ||
| Entrez ID: 54621 | HGNC ID: HGNC:26078 | Ensembl Gene: ENSG00000176834 | OMIM ID: |
Expression of VSIG10:
| Dataset | Gene | EntrezID | Probe | Log2FC | Adj.pValue | Expression |
|---|---|---|---|---|---|---|
| GSE17351 | VSIG10 | 54621 | 223845_at | -0.1998 | 0.6068 | |
| GSE26886 | VSIG10 | 54621 | 223845_at | -0.9075 | 0.0047 | |
| GSE45670 | VSIG10 | 54621 | 223845_at | -0.8155 | 0.0030 | |
| GSE53622 | VSIG10 | 54621 | 51504 | -1.5980 | 0.0000 | |
| GSE53624 | VSIG10 | 54621 | 51504 | -1.6681 | 0.0000 | |
| GSE63941 | VSIG10 | 54621 | 223845_at | 0.6757 | 0.1784 | |
| GSE77861 | VSIG10 | 54621 | 223845_at | -0.1884 | 0.3724 | |
| GSE97050 | VSIG10 | A_21_P0007895 | -0.2216 | 0.5249 | ||
| SRP007169 | VSIG10 | 54621 | RNAseq | -2.3603 | 0.0000 | |
| SRP008496 | VSIG10 | 54621 | RNAseq | -2.0560 | 0.0000 | |
| SRP064894 | VSIG10 | 54621 | RNAseq | -2.3011 | 0.0000 | |
| SRP133303 | VSIG10 | 54621 | RNAseq | -1.6404 | 0.0000 | |
| SRP159526 | VSIG10 | 54621 | RNAseq | -1.4756 | 0.0002 | |
| SRP193095 | VSIG10 | 54621 | RNAseq | -1.2886 | 0.0000 | |
| SRP219564 | VSIG10 | 54621 | RNAseq | -2.0004 | 0.0009 | |
| TCGA | VSIG10 | 54621 | RNAseq | -0.2603 | 0.0177 |
Upregulated datasets: 0; Downregulated datasets: 9.
Survival by VSIG10 expression:
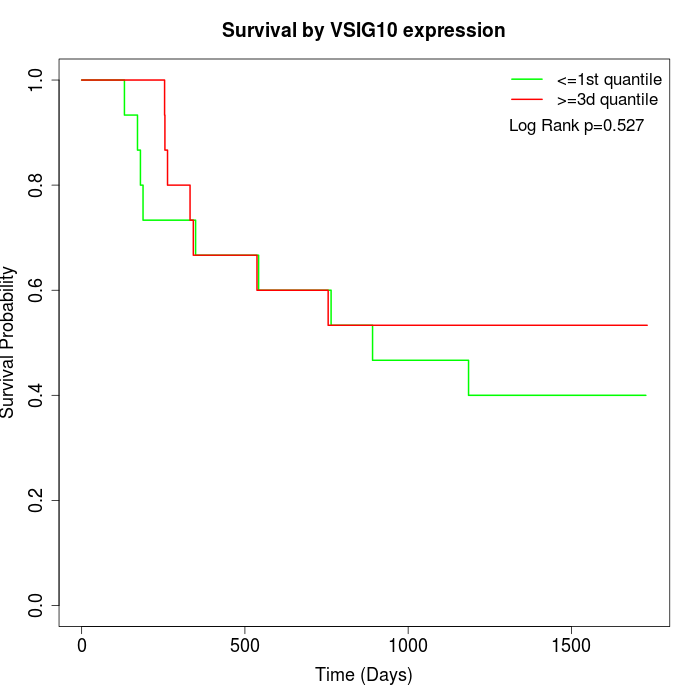 | 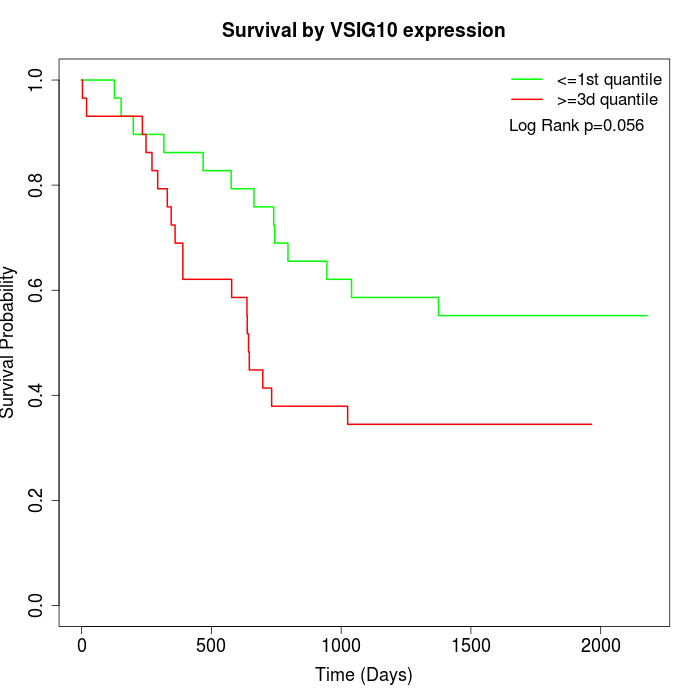 |  |
| GSE53622 | GSE53624 | TCGA |
Note: Click image to view full size file.
Copy number change of VSIG10:
| Dataset | Gene | EntrezID | Gain | Loss | Normal | Detail |
|---|---|---|---|---|---|---|
| GSE15526 | VSIG10 | 54621 | 6 | 2 | 22 | |
| GSE20123 | VSIG10 | 54621 | 6 | 2 | 22 | |
| GSE43470 | VSIG10 | 54621 | 2 | 1 | 40 | |
| GSE46452 | VSIG10 | 54621 | 9 | 1 | 49 | |
| GSE47630 | VSIG10 | 54621 | 9 | 3 | 28 | |
| GSE54993 | VSIG10 | 54621 | 0 | 5 | 65 | |
| GSE54994 | VSIG10 | 54621 | 6 | 6 | 41 | |
| GSE60625 | VSIG10 | 54621 | 0 | 0 | 11 | |
| GSE74703 | VSIG10 | 54621 | 2 | 0 | 34 | |
| GSE74704 | VSIG10 | 54621 | 3 | 2 | 15 | |
| TCGA | VSIG10 | 54621 | 21 | 10 | 65 |
Total number of gains: 64; Total number of losses: 32; Total Number of normals: 392.
Somatic mutations of VSIG10:
Generating mutation plots.
Highly correlated genes for VSIG10:
Showing top 20/488 corelated genes with mean PCC>0.5.
| Gene1 | Gene2 | Mean PCC | Num. Datasets | Num. PCC<0 | Num. PCC>0.5 |
|---|---|---|---|---|---|
| VSIG10 | FAM163B | 0.769033 | 3 | 0 | 3 |
| VSIG10 | RMND5A | 0.766225 | 5 | 0 | 5 |
| VSIG10 | TPRN | 0.736029 | 5 | 0 | 5 |
| VSIG10 | TCP11L2 | 0.724718 | 6 | 0 | 6 |
| VSIG10 | CHP1 | 0.724525 | 5 | 0 | 5 |
| VSIG10 | MUC22 | 0.718817 | 3 | 0 | 3 |
| VSIG10 | TTC9 | 0.716065 | 6 | 0 | 6 |
| VSIG10 | PAK6 | 0.711239 | 3 | 0 | 3 |
| VSIG10 | OTOP3 | 0.709612 | 3 | 0 | 3 |
| VSIG10 | PMM1 | 0.706716 | 6 | 0 | 6 |
| VSIG10 | GCHFR | 0.706466 | 5 | 0 | 4 |
| VSIG10 | PIK3C2B | 0.706003 | 3 | 0 | 3 |
| VSIG10 | YY1AP1 | 0.692296 | 3 | 0 | 3 |
| VSIG10 | SLC9A7 | 0.691066 | 3 | 0 | 3 |
| VSIG10 | ETHE1 | 0.688842 | 5 | 0 | 5 |
| VSIG10 | KRTAP4-1 | 0.68856 | 3 | 0 | 3 |
| VSIG10 | ESPL1 | 0.683408 | 7 | 0 | 6 |
| VSIG10 | EBP | 0.683294 | 3 | 0 | 3 |
| VSIG10 | TST | 0.681225 | 5 | 0 | 5 |
| VSIG10 | MASP2 | 0.680545 | 3 | 0 | 3 |
For details and further investigation, click here