| Full name: extra spindle pole bodies like 1, separase | Alias Symbol: KIAA0165|ESP1|SEPA | ||
| Type: protein-coding gene | Cytoband: 12q13.13 | ||
| Entrez ID: 9700 | HGNC ID: HGNC:16856 | Ensembl Gene: ENSG00000135476 | OMIM ID: 604143 |
ESPL1 involved pathways:
| KEGG pathway | Description | View |
|---|---|---|
| hsa04110 | Cell cycle | |
| hsa04114 | Oocyte meiosis |
Expression of ESPL1:
| Dataset | Gene | EntrezID | Probe | Log2FC | Adj.pValue | Expression |
|---|---|---|---|---|---|---|
| GSE17351 | ESPL1 | 9700 | 38158_at | -1.0633 | 0.2723 | |
| GSE20347 | ESPL1 | 9700 | 38158_at | -1.4231 | 0.0000 | |
| GSE23400 | ESPL1 | 9700 | 38158_at | -1.3783 | 0.0000 | |
| GSE26886 | ESPL1 | 9700 | 38158_at | -2.5199 | 0.0000 | |
| GSE29001 | ESPL1 | 9700 | 38158_at | -1.6585 | 0.0000 | |
| GSE38129 | ESPL1 | 9700 | 38158_at | -0.7765 | 0.0302 | |
| GSE45670 | ESPL1 | 9700 | 38158_at | -1.0122 | 0.0130 | |
| GSE53622 | ESPL1 | 9700 | 138327 | -1.5797 | 0.0000 | |
| GSE53624 | ESPL1 | 9700 | 138327 | -2.0608 | 0.0000 | |
| GSE63941 | ESPL1 | 9700 | 204817_at | 1.2769 | 0.0039 | |
| GSE77861 | ESPL1 | 9700 | 204817_at | -1.1165 | 0.0007 | |
| GSE97050 | ESPL1 | 9700 | A_23_P32707 | -0.1019 | 0.8922 | |
| SRP007169 | ESPL1 | 9700 | RNAseq | -3.1543 | 0.0000 | |
| SRP008496 | ESPL1 | 9700 | RNAseq | -3.3440 | 0.0000 | |
| SRP064894 | ESPL1 | 9700 | RNAseq | -2.5521 | 0.0000 | |
| SRP133303 | ESPL1 | 9700 | RNAseq | -1.3525 | 0.0000 | |
| SRP159526 | ESPL1 | 9700 | RNAseq | -1.5767 | 0.0009 | |
| SRP193095 | ESPL1 | 9700 | RNAseq | -1.4718 | 0.0000 | |
| SRP219564 | ESPL1 | 9700 | RNAseq | -2.0306 | 0.0400 | |
| TCGA | ESPL1 | 9700 | RNAseq | 0.8641 | 0.0000 |
Upregulated datasets: 1; Downregulated datasets: 15.
Survival by ESPL1 expression:
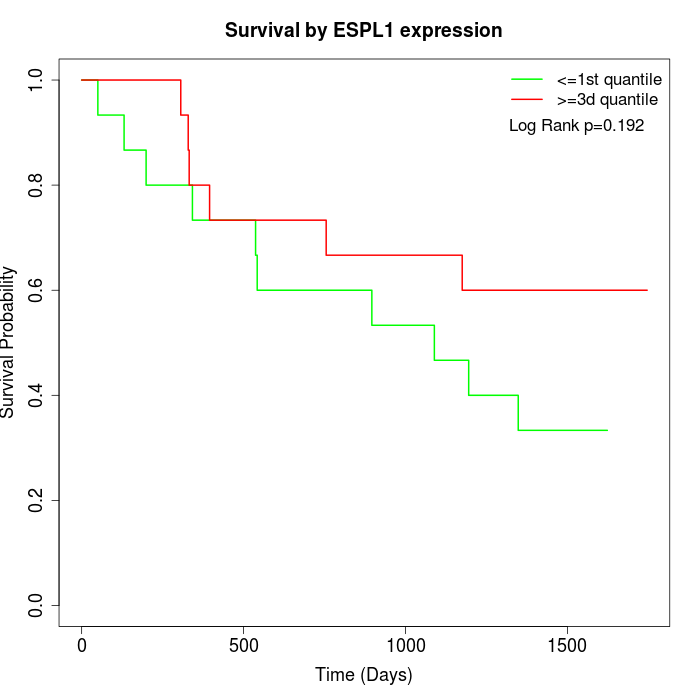 | 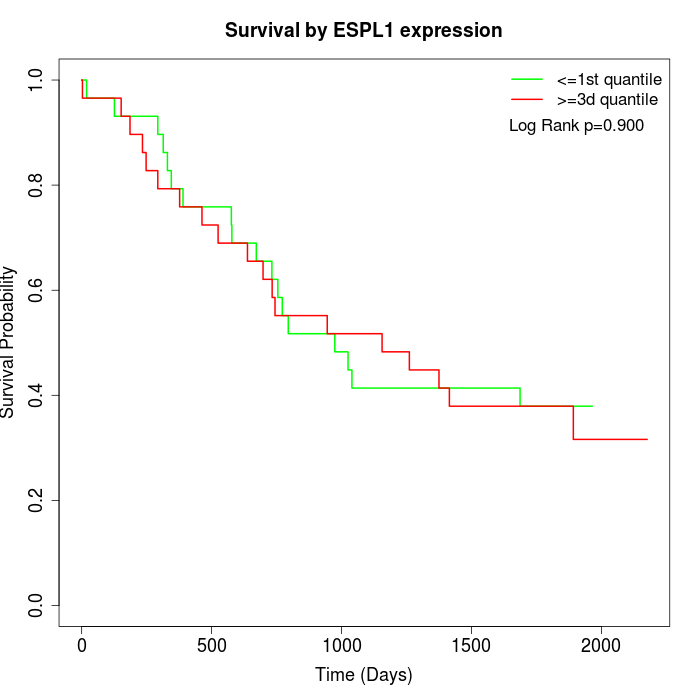 | 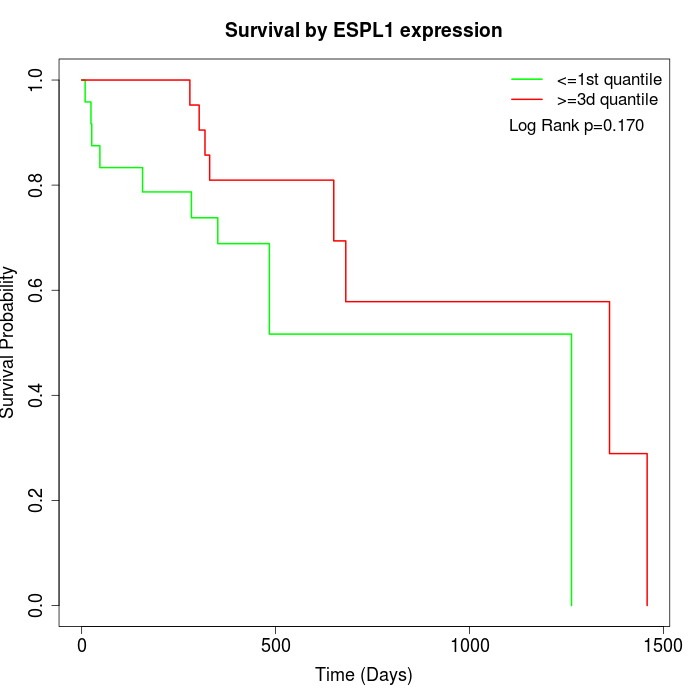 |
| GSE53622 | GSE53624 | TCGA |
Note: Click image to view full size file.
Copy number change of ESPL1:
| Dataset | Gene | EntrezID | Gain | Loss | Normal | Detail |
|---|---|---|---|---|---|---|
| GSE15526 | ESPL1 | 9700 | 7 | 1 | 22 | |
| GSE20123 | ESPL1 | 9700 | 7 | 1 | 22 | |
| GSE43470 | ESPL1 | 9700 | 3 | 0 | 40 | |
| GSE46452 | ESPL1 | 9700 | 7 | 1 | 51 | |
| GSE47630 | ESPL1 | 9700 | 10 | 2 | 28 | |
| GSE54993 | ESPL1 | 9700 | 0 | 5 | 65 | |
| GSE54994 | ESPL1 | 9700 | 4 | 1 | 48 | |
| GSE60625 | ESPL1 | 9700 | 0 | 0 | 11 | |
| GSE74703 | ESPL1 | 9700 | 3 | 0 | 33 | |
| GSE74704 | ESPL1 | 9700 | 5 | 1 | 14 | |
| TCGA | ESPL1 | 9700 | 14 | 11 | 71 |
Total number of gains: 60; Total number of losses: 23; Total Number of normals: 405.
Somatic mutations of ESPL1:
Generating mutation plots.
Highly correlated genes for ESPL1:
Showing top 20/1051 corelated genes with mean PCC>0.5.
| Gene1 | Gene2 | Mean PCC | Num. Datasets | Num. PCC<0 | Num. PCC>0.5 |
|---|---|---|---|---|---|
| ESPL1 | SFTA2 | 0.870871 | 4 | 0 | 4 |
| ESPL1 | SPNS2 | 0.86868 | 4 | 0 | 4 |
| ESPL1 | NCCRP1 | 0.862728 | 3 | 0 | 3 |
| ESPL1 | GYS2 | 0.856141 | 10 | 0 | 10 |
| ESPL1 | TTC9 | 0.851137 | 10 | 0 | 10 |
| ESPL1 | SH3GL1 | 0.850458 | 10 | 0 | 10 |
| ESPL1 | SCNN1B | 0.849336 | 11 | 0 | 11 |
| ESPL1 | ANXA9 | 0.844397 | 10 | 0 | 10 |
| ESPL1 | RAET1E | 0.843637 | 7 | 0 | 7 |
| ESPL1 | GDPD3 | 0.84309 | 11 | 0 | 11 |
| ESPL1 | EPS8L2 | 0.842024 | 11 | 0 | 11 |
| ESPL1 | UPK1A | 0.838446 | 11 | 0 | 11 |
| ESPL1 | ATP6V1C2 | 0.836562 | 4 | 0 | 4 |
| ESPL1 | SLC16A6 | 0.835414 | 10 | 0 | 10 |
| ESPL1 | IL36A | 0.832918 | 11 | 0 | 11 |
| ESPL1 | SMAGP | 0.83165 | 12 | 0 | 12 |
| ESPL1 | ULK3 | 0.830861 | 6 | 0 | 6 |
| ESPL1 | CYSRT1 | 0.828563 | 6 | 0 | 6 |
| ESPL1 | SLURP1 | 0.827417 | 11 | 0 | 11 |
| ESPL1 | BLNK | 0.826159 | 10 | 0 | 10 |
For details and further investigation, click here