| Full name: X-prolyl aminopeptidase 3 | Alias Symbol: APP3|NPHPL1|ICP55 | ||
| Type: protein-coding gene | Cytoband: 22q13.2 | ||
| Entrez ID: 63929 | HGNC ID: HGNC:28052 | Ensembl Gene: ENSG00000196236 | OMIM ID: 613553 |
| Related drugs: TOSEDOSTAT... [more] | |||
Screen Evidence:
| |||
Expression of XPNPEP3:
| Dataset | Gene | EntrezID | Probe | Log2FC | Adj.pValue | Expression |
|---|---|---|---|---|---|---|
| GSE17351 | XPNPEP3 | 63929 | 226501_at | 0.6897 | 0.3326 | |
| GSE20347 | XPNPEP3 | 63929 | 220020_at | 0.1263 | 0.4745 | |
| GSE23400 | XPNPEP3 | 63929 | 220020_at | -0.0618 | 0.1609 | |
| GSE26886 | XPNPEP3 | 63929 | 226501_at | 0.2812 | 0.2848 | |
| GSE29001 | XPNPEP3 | 63929 | 220020_at | 0.3092 | 0.0586 | |
| GSE38129 | XPNPEP3 | 63929 | 220020_at | 0.0520 | 0.8417 | |
| GSE45670 | XPNPEP3 | 63929 | 226501_at | 0.4149 | 0.0150 | |
| GSE53622 | XPNPEP3 | 63929 | 49356 | 0.2833 | 0.0000 | |
| GSE53624 | XPNPEP3 | 63929 | 49356 | 0.4811 | 0.0000 | |
| GSE63941 | XPNPEP3 | 63929 | 226501_at | -0.0289 | 0.9573 | |
| GSE77861 | XPNPEP3 | 63929 | 226501_at | 0.7061 | 0.0873 | |
| GSE97050 | XPNPEP3 | 63929 | A_23_P218793 | 0.1313 | 0.6565 | |
| SRP007169 | XPNPEP3 | 63929 | RNAseq | 0.3914 | 0.3425 | |
| SRP008496 | XPNPEP3 | 63929 | RNAseq | 0.2951 | 0.2770 | |
| SRP064894 | XPNPEP3 | 63929 | RNAseq | 0.3828 | 0.0363 | |
| SRP133303 | XPNPEP3 | 63929 | RNAseq | 0.4316 | 0.0009 | |
| SRP159526 | XPNPEP3 | 63929 | RNAseq | 0.9372 | 0.0017 | |
| SRP193095 | XPNPEP3 | 63929 | RNAseq | 0.3791 | 0.0000 | |
| SRP219564 | XPNPEP3 | 63929 | RNAseq | 0.8794 | 0.0702 | |
| TCGA | XPNPEP3 | 63929 | RNAseq | 0.0589 | 0.3084 |
Upregulated datasets: 0; Downregulated datasets: 0.
Survival by XPNPEP3 expression:
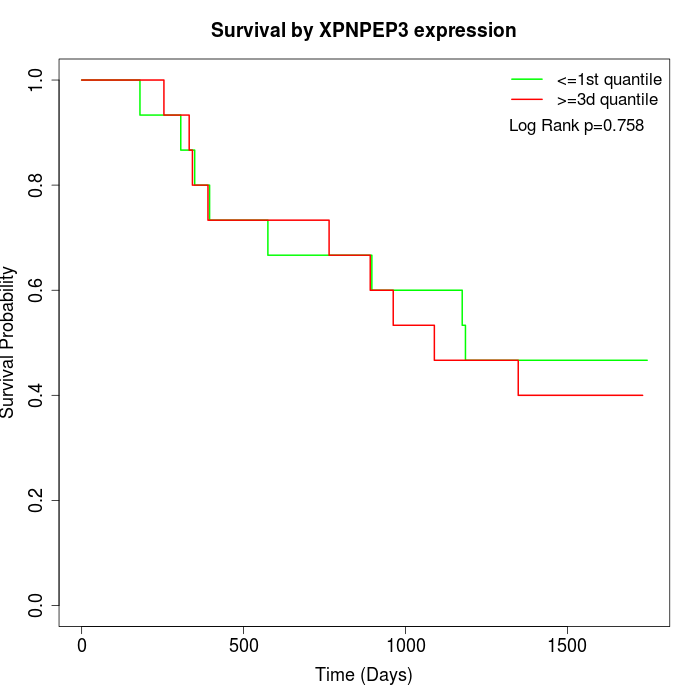 | 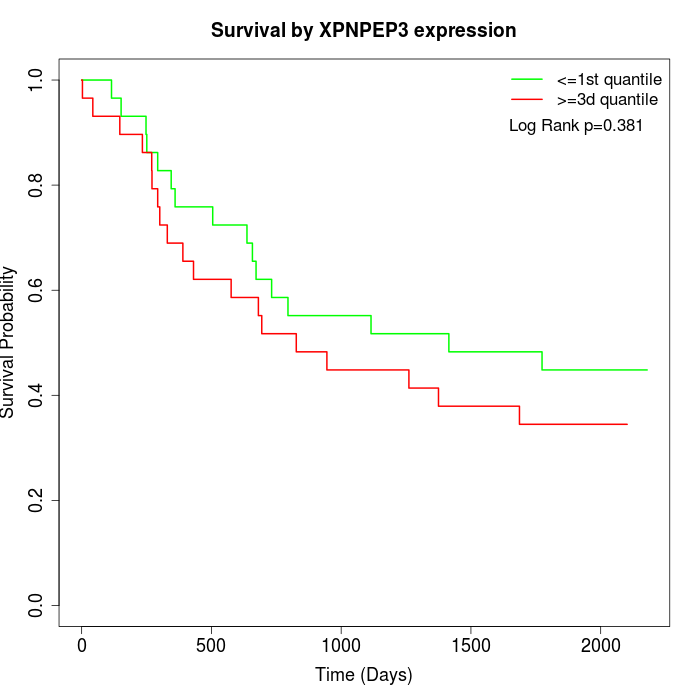 | 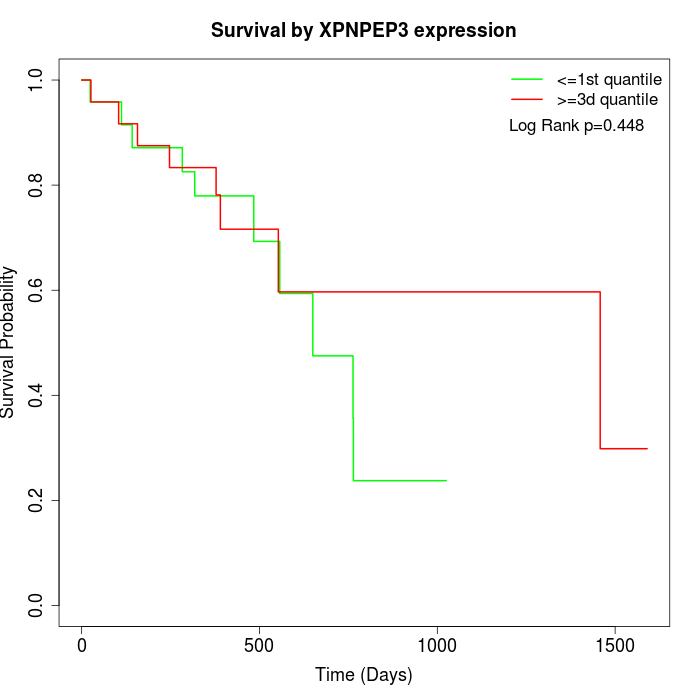 |
| GSE53622 | GSE53624 | TCGA |
Note: Click image to view full size file.
Copy number change of XPNPEP3:
| Dataset | Gene | EntrezID | Gain | Loss | Normal | Detail |
|---|---|---|---|---|---|---|
| GSE15526 | XPNPEP3 | 63929 | 6 | 5 | 19 | |
| GSE20123 | XPNPEP3 | 63929 | 6 | 4 | 20 | |
| GSE43470 | XPNPEP3 | 63929 | 4 | 6 | 33 | |
| GSE46452 | XPNPEP3 | 63929 | 31 | 2 | 26 | |
| GSE47630 | XPNPEP3 | 63929 | 9 | 4 | 27 | |
| GSE54993 | XPNPEP3 | 63929 | 3 | 6 | 61 | |
| GSE54994 | XPNPEP3 | 63929 | 11 | 7 | 35 | |
| GSE60625 | XPNPEP3 | 63929 | 5 | 0 | 6 | |
| GSE74703 | XPNPEP3 | 63929 | 4 | 4 | 28 | |
| GSE74704 | XPNPEP3 | 63929 | 3 | 2 | 15 | |
| TCGA | XPNPEP3 | 63929 | 26 | 15 | 55 |
Total number of gains: 108; Total number of losses: 55; Total Number of normals: 325.
Somatic mutations of XPNPEP3:
Generating mutation plots.
Highly correlated genes for XPNPEP3:
Showing top 20/616 corelated genes with mean PCC>0.5.
| Gene1 | Gene2 | Mean PCC | Num. Datasets | Num. PCC<0 | Num. PCC>0.5 |
|---|---|---|---|---|---|
| XPNPEP3 | NIPA2 | 0.796082 | 3 | 0 | 3 |
| XPNPEP3 | EZH2 | 0.770724 | 4 | 0 | 3 |
| XPNPEP3 | GSTCD | 0.761115 | 5 | 0 | 5 |
| XPNPEP3 | PATL1 | 0.758598 | 3 | 0 | 3 |
| XPNPEP3 | HS6ST1 | 0.742761 | 4 | 0 | 4 |
| XPNPEP3 | CDT1 | 0.734694 | 4 | 0 | 4 |
| XPNPEP3 | SPRED1 | 0.730781 | 4 | 0 | 4 |
| XPNPEP3 | SPNS1 | 0.723217 | 4 | 0 | 4 |
| XPNPEP3 | MCMBP | 0.722573 | 3 | 0 | 3 |
| XPNPEP3 | PFAS | 0.716286 | 3 | 0 | 3 |
| XPNPEP3 | SDHAF2 | 0.714657 | 4 | 0 | 3 |
| XPNPEP3 | ZNF7 | 0.713203 | 4 | 0 | 4 |
| XPNPEP3 | GATAD1 | 0.713089 | 4 | 0 | 3 |
| XPNPEP3 | CDC37 | 0.712491 | 3 | 0 | 3 |
| XPNPEP3 | ZNF322 | 0.711732 | 3 | 0 | 3 |
| XPNPEP3 | IRF2BPL | 0.711381 | 4 | 0 | 3 |
| XPNPEP3 | GTPBP3 | 0.709239 | 3 | 0 | 3 |
| XPNPEP3 | ZBTB34 | 0.707283 | 3 | 0 | 3 |
| XPNPEP3 | TAF6 | 0.706772 | 4 | 0 | 4 |
| XPNPEP3 | PIGU | 0.705217 | 3 | 0 | 3 |
For details and further investigation, click here