| Full name: GTP binding protein 3, mitochondrial | Alias Symbol: MSS1|THDF1|GTPBG3|MTGP1|FLJ14700 | ||
| Type: protein-coding gene | Cytoband: 19p13.11 | ||
| Entrez ID: 84705 | HGNC ID: HGNC:14880 | Ensembl Gene: ENSG00000130299 | OMIM ID: 608536 |
Expression of GTPBP3:
| Dataset | Gene | EntrezID | Probe | Log2FC | Adj.pValue | Expression |
|---|---|---|---|---|---|---|
| GSE17351 | GTPBP3 | 84705 | 213835_x_at | 0.1712 | 0.6321 | |
| GSE20347 | GTPBP3 | 84705 | 213835_x_at | 0.3700 | 0.0014 | |
| GSE23400 | GTPBP3 | 84705 | 213835_x_at | 0.1533 | 0.0001 | |
| GSE26886 | GTPBP3 | 84705 | 213835_x_at | 0.9984 | 0.0000 | |
| GSE29001 | GTPBP3 | 84705 | 213835_x_at | 0.0445 | 0.8357 | |
| GSE38129 | GTPBP3 | 84705 | 213835_x_at | 0.3391 | 0.0013 | |
| GSE45670 | GTPBP3 | 84705 | 213835_x_at | 0.2008 | 0.0766 | |
| GSE53622 | GTPBP3 | 84705 | 26356 | 0.5005 | 0.0000 | |
| GSE53624 | GTPBP3 | 84705 | 34320 | 0.5324 | 0.0000 | |
| GSE63941 | GTPBP3 | 84705 | 213835_x_at | 1.4135 | 0.0000 | |
| GSE77861 | GTPBP3 | 84705 | 213835_x_at | 0.2169 | 0.1475 | |
| GSE97050 | GTPBP3 | 84705 | A_23_P28068 | 0.4360 | 0.2151 | |
| SRP007169 | GTPBP3 | 84705 | RNAseq | 0.1333 | 0.7391 | |
| SRP008496 | GTPBP3 | 84705 | RNAseq | 0.5229 | 0.0649 | |
| SRP064894 | GTPBP3 | 84705 | RNAseq | 0.5448 | 0.0020 | |
| SRP133303 | GTPBP3 | 84705 | RNAseq | 0.2952 | 0.0646 | |
| SRP159526 | GTPBP3 | 84705 | RNAseq | 0.7704 | 0.0053 | |
| SRP193095 | GTPBP3 | 84705 | RNAseq | 0.4753 | 0.0000 | |
| SRP219564 | GTPBP3 | 84705 | RNAseq | 0.7143 | 0.0684 | |
| TCGA | GTPBP3 | 84705 | RNAseq | 0.2738 | 0.0000 |
Upregulated datasets: 1; Downregulated datasets: 0.
Survival by GTPBP3 expression:
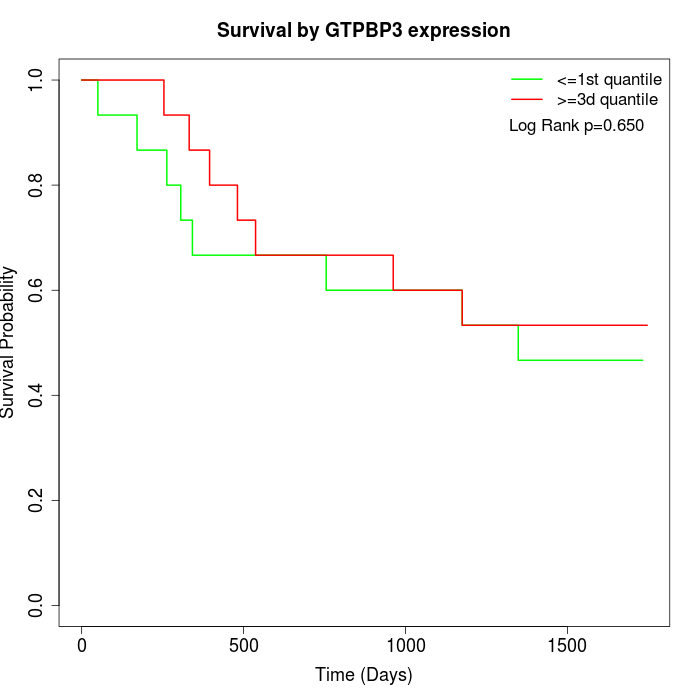 | 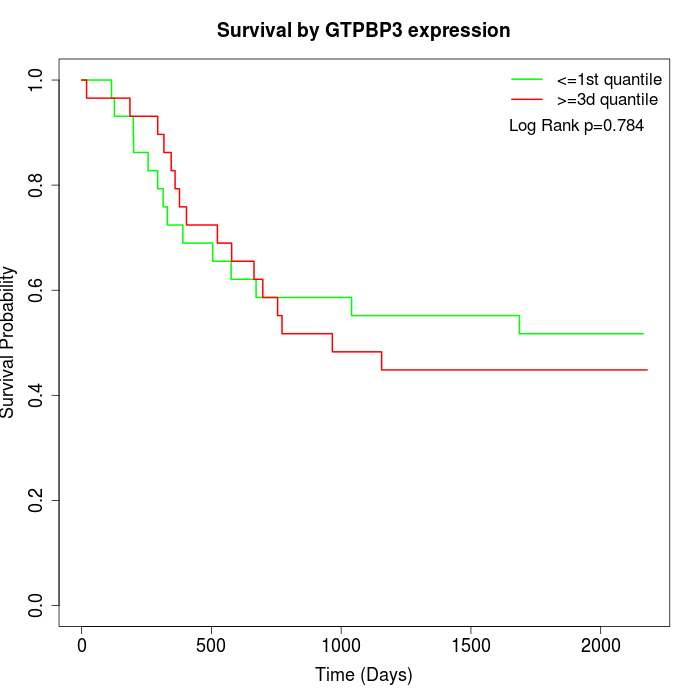 | 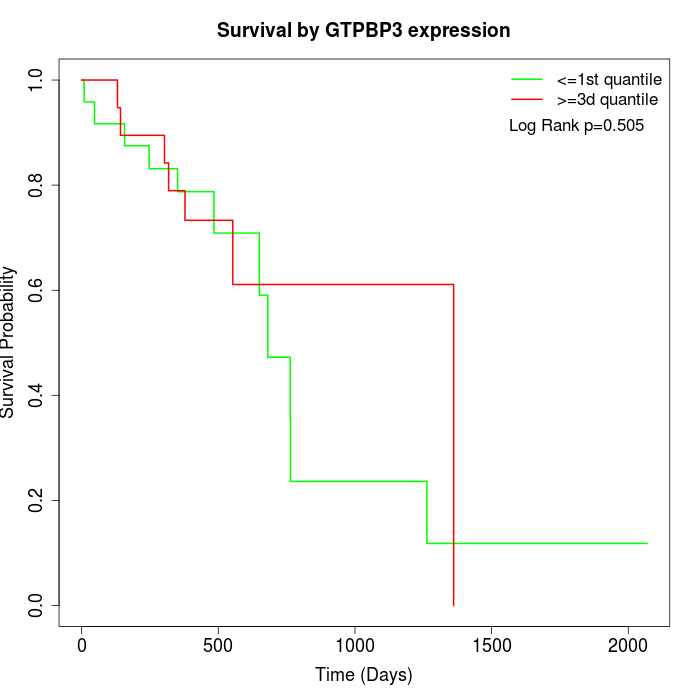 |
| GSE53622 | GSE53624 | TCGA |
Note: Click image to view full size file.
Copy number change of GTPBP3:
| Dataset | Gene | EntrezID | Gain | Loss | Normal | Detail |
|---|---|---|---|---|---|---|
| GSE15526 | GTPBP3 | 84705 | 4 | 4 | 22 | |
| GSE20123 | GTPBP3 | 84705 | 3 | 2 | 25 | |
| GSE43470 | GTPBP3 | 84705 | 2 | 6 | 35 | |
| GSE46452 | GTPBP3 | 84705 | 47 | 1 | 11 | |
| GSE47630 | GTPBP3 | 84705 | 4 | 8 | 28 | |
| GSE54993 | GTPBP3 | 84705 | 15 | 4 | 51 | |
| GSE54994 | GTPBP3 | 84705 | 6 | 14 | 33 | |
| GSE60625 | GTPBP3 | 84705 | 9 | 0 | 2 | |
| GSE74703 | GTPBP3 | 84705 | 2 | 4 | 30 | |
| GSE74704 | GTPBP3 | 84705 | 0 | 2 | 18 | |
| TCGA | GTPBP3 | 84705 | 17 | 9 | 70 |
Total number of gains: 109; Total number of losses: 54; Total Number of normals: 325.
Somatic mutations of GTPBP3:
Generating mutation plots.
Highly correlated genes for GTPBP3:
Showing top 20/1262 corelated genes with mean PCC>0.5.
| Gene1 | Gene2 | Mean PCC | Num. Datasets | Num. PCC<0 | Num. PCC>0.5 |
|---|---|---|---|---|---|
| GTPBP3 | CHCHD2 | 0.74021 | 5 | 0 | 5 |
| GTPBP3 | APOBEC3G | 0.739187 | 3 | 0 | 3 |
| GTPBP3 | RNF26 | 0.728682 | 3 | 0 | 3 |
| GTPBP3 | ITGB8 | 0.728118 | 3 | 0 | 3 |
| GTPBP3 | ZFP90 | 0.723088 | 3 | 0 | 3 |
| GTPBP3 | TMEM216 | 0.717363 | 3 | 0 | 3 |
| GTPBP3 | XPNPEP3 | 0.709239 | 3 | 0 | 3 |
| GTPBP3 | MTBP | 0.70165 | 4 | 0 | 4 |
| GTPBP3 | CCDC58 | 0.69952 | 3 | 0 | 3 |
| GTPBP3 | CDK5 | 0.698653 | 4 | 0 | 4 |
| GTPBP3 | LEMD2 | 0.698172 | 3 | 0 | 3 |
| GTPBP3 | DDX11 | 0.693882 | 8 | 0 | 7 |
| GTPBP3 | CIZ1 | 0.693311 | 5 | 0 | 5 |
| GTPBP3 | PKP2 | 0.692479 | 3 | 0 | 3 |
| GTPBP3 | FIZ1 | 0.691969 | 3 | 0 | 3 |
| GTPBP3 | MRPL11 | 0.689505 | 4 | 0 | 4 |
| GTPBP3 | FANCD2 | 0.687922 | 5 | 0 | 5 |
| GTPBP3 | HNRNPF | 0.687789 | 3 | 0 | 3 |
| GTPBP3 | HSPA13 | 0.687476 | 3 | 0 | 3 |
| GTPBP3 | AEBP2 | 0.685455 | 3 | 0 | 3 |
For details and further investigation, click here