| Full name: ZEB1 antisense RNA 1 | Alias Symbol: | ||
| Type: non-coding RNA | Cytoband: 10p11.22 | ||
| Entrez ID: 220930 | HGNC ID: HGNC:42354 | Ensembl Gene: ENSG00000237036 | OMIM ID: 616915 |
Expression of ZEB1-AS1:
| Dataset | Gene | EntrezID | Probe | Log2FC | Adj.pValue | Expression |
|---|---|---|---|---|---|---|
| GSE17351 | ZEB1-AS1 | 220930 | 229090_at | 0.0575 | 0.9557 | |
| GSE26886 | ZEB1-AS1 | 220930 | 229090_at | 1.2364 | 0.0002 | |
| GSE45670 | ZEB1-AS1 | 220930 | 229090_at | -0.0837 | 0.8662 | |
| GSE53622 | ZEB1-AS1 | 220930 | 19136 | 0.1479 | 0.0345 | |
| GSE53624 | ZEB1-AS1 | 220930 | 19136 | 0.2879 | 0.0000 | |
| GSE63941 | ZEB1-AS1 | 220930 | 229090_at | -0.1075 | 0.9088 | |
| GSE77861 | ZEB1-AS1 | 220930 | 229090_at | 0.0594 | 0.6726 | |
| SRP007169 | ZEB1-AS1 | 220930 | RNAseq | 0.4675 | 0.5033 | |
| SRP008496 | ZEB1-AS1 | 220930 | RNAseq | 1.4351 | 0.0120 | |
| SRP064894 | ZEB1-AS1 | 220930 | RNAseq | 0.5611 | 0.0017 | |
| SRP133303 | ZEB1-AS1 | 220930 | RNAseq | 0.2388 | 0.1882 | |
| SRP159526 | ZEB1-AS1 | 220930 | RNAseq | 0.8029 | 0.0158 | |
| SRP193095 | ZEB1-AS1 | 220930 | RNAseq | 0.8650 | 0.0000 | |
| SRP219564 | ZEB1-AS1 | 220930 | RNAseq | 0.5957 | 0.0278 |
Upregulated datasets: 2; Downregulated datasets: 0.
Survival by ZEB1-AS1 expression:
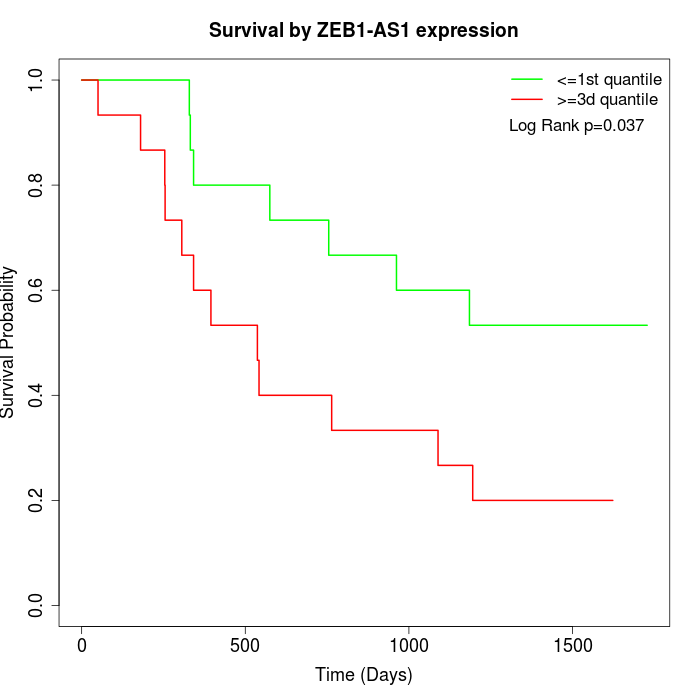 | 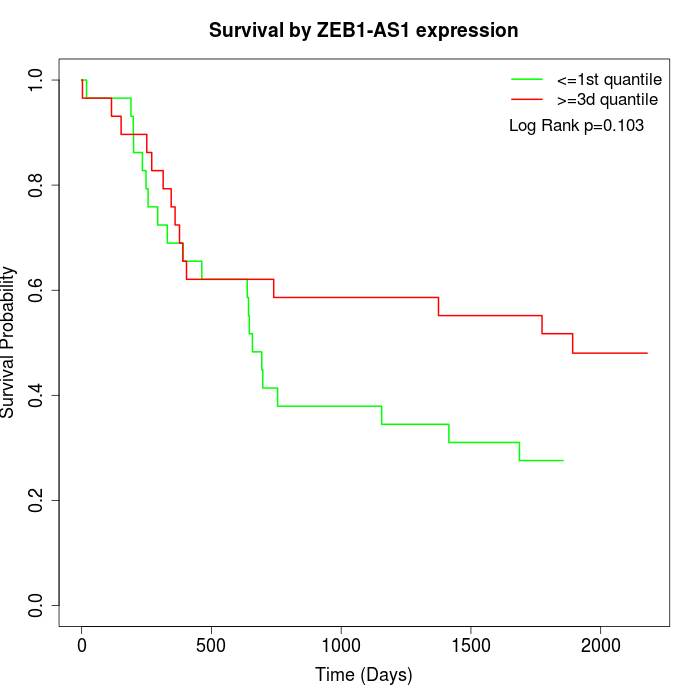 |
| GSE53622 | GSE53624 |
Note: Click image to view full size file.
Copy number change of ZEB1-AS1:
| Dataset | Gene | EntrezID | Gain | Loss | Normal | Detail |
|---|---|---|---|---|---|---|
| GSE15526 | ZEB1-AS1 | 220930 | 5 | 7 | 18 | |
| GSE20123 | ZEB1-AS1 | 220930 | 5 | 6 | 19 | |
| GSE43470 | ZEB1-AS1 | 220930 | 4 | 3 | 36 | |
| GSE46452 | ZEB1-AS1 | 220930 | 1 | 14 | 44 | |
| GSE47630 | ZEB1-AS1 | 220930 | 5 | 15 | 20 | |
| GSE54993 | ZEB1-AS1 | 220930 | 9 | 0 | 61 | |
| GSE54994 | ZEB1-AS1 | 220930 | 3 | 9 | 41 | |
| GSE60625 | ZEB1-AS1 | 220930 | 0 | 0 | 11 | |
| GSE74703 | ZEB1-AS1 | 220930 | 2 | 2 | 32 | |
| GSE74704 | ZEB1-AS1 | 220930 | 0 | 5 | 15 |
Total number of gains: 34; Total number of losses: 61; Total Number of normals: 297.
Somatic mutations of ZEB1-AS1:
Generating mutation plots.
Highly correlated genes for ZEB1-AS1:
Showing top 20/50 corelated genes with mean PCC>0.5.
| Gene1 | Gene2 | Mean PCC | Num. Datasets | Num. PCC<0 | Num. PCC>0.5 |
|---|---|---|---|---|---|
| ZEB1-AS1 | SLC52A1 | 0.704887 | 3 | 0 | 3 |
| ZEB1-AS1 | SHISA7 | 0.696956 | 3 | 0 | 3 |
| ZEB1-AS1 | C16orf86 | 0.696836 | 3 | 0 | 3 |
| ZEB1-AS1 | ALX4 | 0.692715 | 3 | 0 | 3 |
| ZEB1-AS1 | CLTCL1 | 0.690325 | 3 | 0 | 3 |
| ZEB1-AS1 | RAVER1 | 0.690213 | 3 | 0 | 3 |
| ZEB1-AS1 | SLC38A6 | 0.67493 | 4 | 0 | 4 |
| ZEB1-AS1 | CENPV | 0.672534 | 3 | 0 | 3 |
| ZEB1-AS1 | SPRED3 | 0.664745 | 3 | 0 | 3 |
| ZEB1-AS1 | PRR18 | 0.662329 | 3 | 0 | 3 |
| ZEB1-AS1 | HMGA2 | 0.645112 | 3 | 0 | 3 |
| ZEB1-AS1 | PAX6 | 0.63892 | 4 | 0 | 4 |
| ZEB1-AS1 | THOC5 | 0.637206 | 3 | 0 | 3 |
| ZEB1-AS1 | FOXO6 | 0.635795 | 3 | 0 | 3 |
| ZEB1-AS1 | THRA | 0.620649 | 4 | 0 | 4 |
| ZEB1-AS1 | TUSC1 | 0.616649 | 3 | 0 | 3 |
| ZEB1-AS1 | POLD1 | 0.611902 | 3 | 0 | 3 |
| ZEB1-AS1 | OBSL1 | 0.607078 | 5 | 0 | 5 |
| ZEB1-AS1 | LINC00881 | 0.605557 | 3 | 0 | 3 |
| ZEB1-AS1 | ST8SIA1 | 0.603141 | 4 | 0 | 4 |
For details and further investigation, click here