| Full name: angiogenin | Alias Symbol: RNASE5|RAA1 | ||
| Type: protein-coding gene | Cytoband: 14q11.2 | ||
| Entrez ID: 283 | HGNC ID: HGNC:483 | Ensembl Gene: ENSG00000214274 | OMIM ID: 105850 |
Expression of ANG:
| Dataset | Gene | EntrezID | Probe | Log2FC | Adj.pValue | Expression |
|---|---|---|---|---|---|---|
| GSE17351 | ANG | 283 | 205141_at | -0.7040 | 0.2838 | |
| GSE20347 | ANG | 283 | 205141_at | -0.2817 | 0.0295 | |
| GSE23400 | ANG | 283 | 205141_at | -0.2411 | 0.0000 | |
| GSE26886 | ANG | 283 | 205141_at | 0.5669 | 0.0058 | |
| GSE29001 | ANG | 283 | 205141_at | -0.0774 | 0.7970 | |
| GSE38129 | ANG | 283 | 205141_at | -0.5941 | 0.0301 | |
| GSE45670 | ANG | 283 | 205141_at | -1.0437 | 0.0003 | |
| GSE53622 | ANG | 283 | 17255 | -0.9050 | 0.0000 | |
| GSE53624 | ANG | 283 | 17255 | -0.8177 | 0.0000 | |
| GSE63941 | ANG | 283 | 205141_at | -0.1417 | 0.8972 | |
| GSE77861 | ANG | 283 | 205141_at | -0.0231 | 0.9566 | |
| GSE97050 | ANG | 283 | A_33_P3236177 | -0.3205 | 0.3164 | |
| SRP064894 | ANG | 283 | RNAseq | -0.3201 | 0.4975 | |
| SRP133303 | ANG | 283 | RNAseq | -0.9475 | 0.0038 | |
| SRP159526 | ANG | 283 | RNAseq | -0.4281 | 0.3724 | |
| SRP193095 | ANG | 283 | RNAseq | -0.8366 | 0.0674 | |
| SRP219564 | ANG | 283 | RNAseq | -0.5586 | 0.2104 | |
| TCGA | ANG | 283 | RNAseq | -1.0518 | 0.0000 |
Upregulated datasets: 0; Downregulated datasets: 2.
Survival by ANG expression:
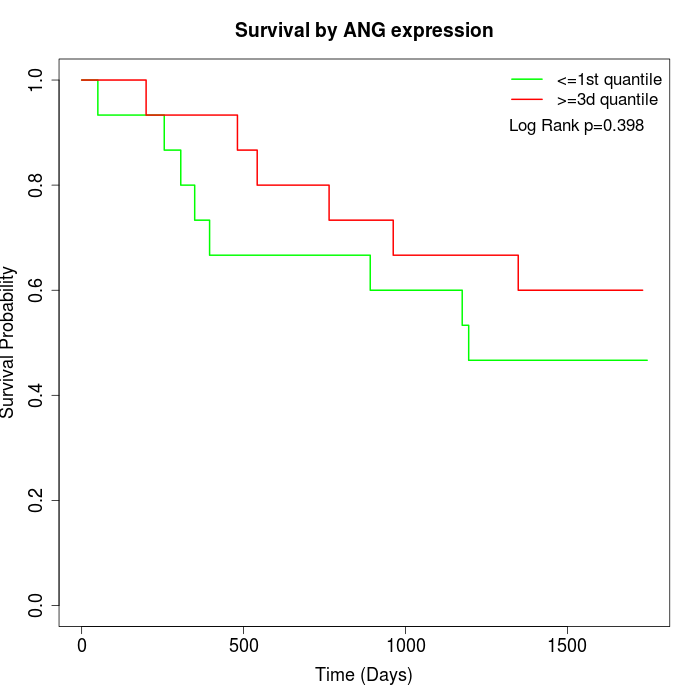 | 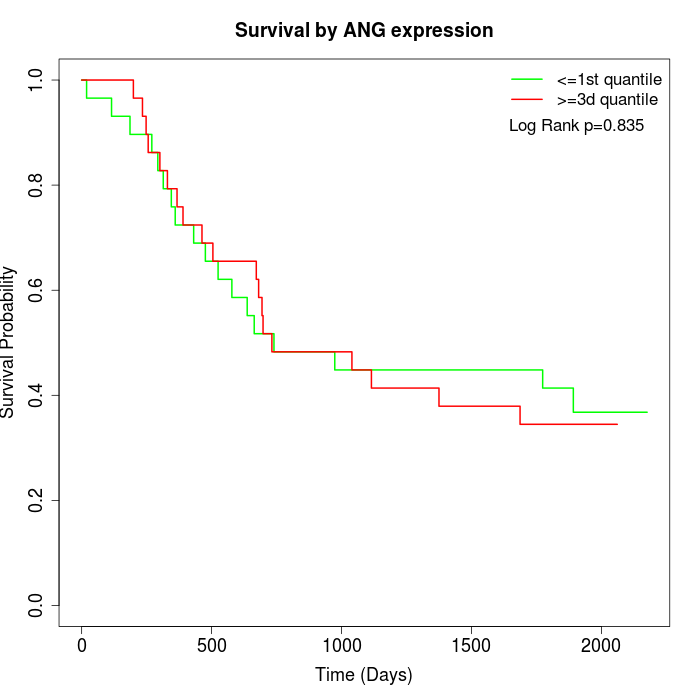 | 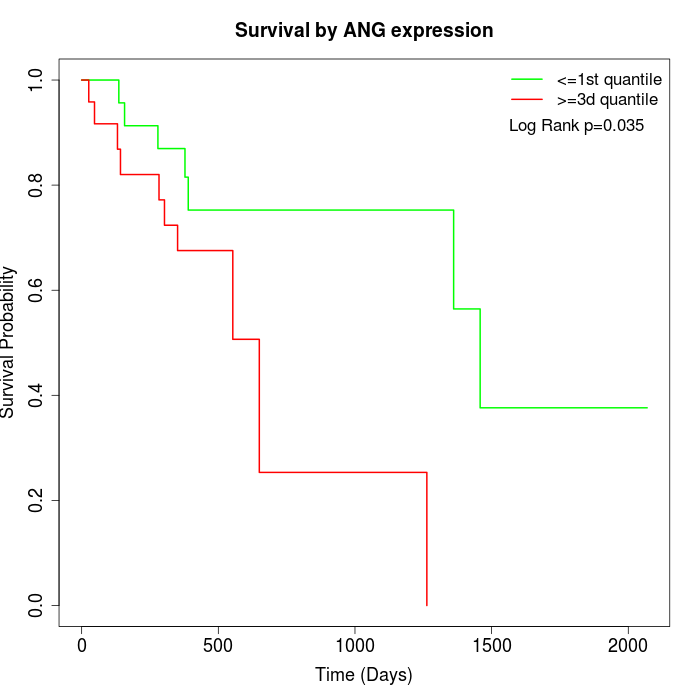 |
| GSE53622 | GSE53624 | TCGA |
Note: Click image to view full size file.
Copy number change of ANG:
| Dataset | Gene | EntrezID | Gain | Loss | Normal | Detail |
|---|---|---|---|---|---|---|
| GSE15526 | ANG | 283 | 9 | 3 | 18 | |
| GSE20123 | ANG | 283 | 8 | 3 | 19 | |
| GSE43470 | ANG | 283 | 7 | 1 | 35 | |
| GSE46452 | ANG | 283 | 19 | 2 | 38 | |
| GSE47630 | ANG | 283 | 10 | 10 | 20 | |
| GSE54993 | ANG | 283 | 3 | 11 | 56 | |
| GSE54994 | ANG | 283 | 17 | 5 | 31 | |
| GSE60625 | ANG | 283 | 0 | 2 | 9 | |
| GSE74703 | ANG | 283 | 6 | 1 | 29 | |
| GSE74704 | ANG | 283 | 4 | 2 | 14 | |
| TCGA | ANG | 283 | 28 | 16 | 52 |
Total number of gains: 111; Total number of losses: 56; Total Number of normals: 321.
Somatic mutations of ANG:
Generating mutation plots.
Highly correlated genes for ANG:
Showing top 20/653 corelated genes with mean PCC>0.5.
| Gene1 | Gene2 | Mean PCC | Num. Datasets | Num. PCC<0 | Num. PCC>0.5 |
|---|---|---|---|---|---|
| ANG | UBE2Q2 | 0.797424 | 3 | 0 | 3 |
| ANG | RNASE4 | 0.79528 | 10 | 0 | 10 |
| ANG | SIVA1 | 0.769211 | 3 | 0 | 3 |
| ANG | SAR1A | 0.755931 | 3 | 0 | 3 |
| ANG | C9orf47 | 0.755348 | 3 | 0 | 3 |
| ANG | REEP5 | 0.744659 | 5 | 0 | 5 |
| ANG | RTN3 | 0.728838 | 4 | 0 | 4 |
| ANG | CCDC91 | 0.728556 | 3 | 0 | 3 |
| ANG | ADH1A | 0.727006 | 3 | 0 | 3 |
| ANG | PHPT1 | 0.723183 | 3 | 0 | 3 |
| ANG | DNAJC18 | 0.720879 | 3 | 0 | 3 |
| ANG | PTPN21 | 0.717062 | 4 | 0 | 3 |
| ANG | STARD9 | 0.71578 | 3 | 0 | 3 |
| ANG | TAF7 | 0.715069 | 4 | 0 | 3 |
| ANG | ZBTB25 | 0.713343 | 4 | 0 | 4 |
| ANG | USP33 | 0.706782 | 3 | 0 | 3 |
| ANG | TMED10 | 0.704457 | 3 | 0 | 3 |
| ANG | FBXL3 | 0.700128 | 3 | 0 | 3 |
| ANG | BBS7 | 0.69937 | 3 | 0 | 3 |
| ANG | SDHD | 0.698146 | 3 | 0 | 3 |
For details and further investigation, click here