| Full name: adaptor related protein complex 1 subunit mu 1 | Alias Symbol: AP47|CLAPM2 | ||
| Type: protein-coding gene | Cytoband: 19p13.11 | ||
| Entrez ID: 8907 | HGNC ID: HGNC:13667 | Ensembl Gene: ENSG00000072958 | OMIM ID: 603535 |
Expression of AP1M1:
| Dataset | Gene | EntrezID | Probe | Log2FC | Adj.pValue | Expression |
|---|---|---|---|---|---|---|
| GSE17351 | AP1M1 | 8907 | 223024_at | 0.2613 | 0.4540 | |
| GSE26886 | AP1M1 | 8907 | 223024_at | 0.6419 | 0.0003 | |
| GSE45670 | AP1M1 | 8907 | 223024_at | 0.1122 | 0.5705 | |
| GSE53622 | AP1M1 | 8907 | 131501 | 0.2840 | 0.0000 | |
| GSE53624 | AP1M1 | 8907 | 131501 | 0.4658 | 0.0000 | |
| GSE63941 | AP1M1 | 8907 | 223024_at | -0.4714 | 0.3422 | |
| GSE77861 | AP1M1 | 8907 | 223024_at | 0.3658 | 0.1901 | |
| GSE97050 | AP1M1 | 8907 | A_23_P55802 | 0.1853 | 0.3183 | |
| SRP007169 | AP1M1 | 8907 | RNAseq | 0.0294 | 0.9357 | |
| SRP008496 | AP1M1 | 8907 | RNAseq | -0.0346 | 0.8724 | |
| SRP064894 | AP1M1 | 8907 | RNAseq | 0.7827 | 0.0000 | |
| SRP133303 | AP1M1 | 8907 | RNAseq | 0.0924 | 0.3036 | |
| SRP159526 | AP1M1 | 8907 | RNAseq | 0.1864 | 0.2214 | |
| SRP193095 | AP1M1 | 8907 | RNAseq | 0.2920 | 0.0037 | |
| SRP219564 | AP1M1 | 8907 | RNAseq | 0.5858 | 0.1006 | |
| TCGA | AP1M1 | 8907 | RNAseq | 0.1165 | 0.0201 |
Upregulated datasets: 0; Downregulated datasets: 0.
Survival by AP1M1 expression:
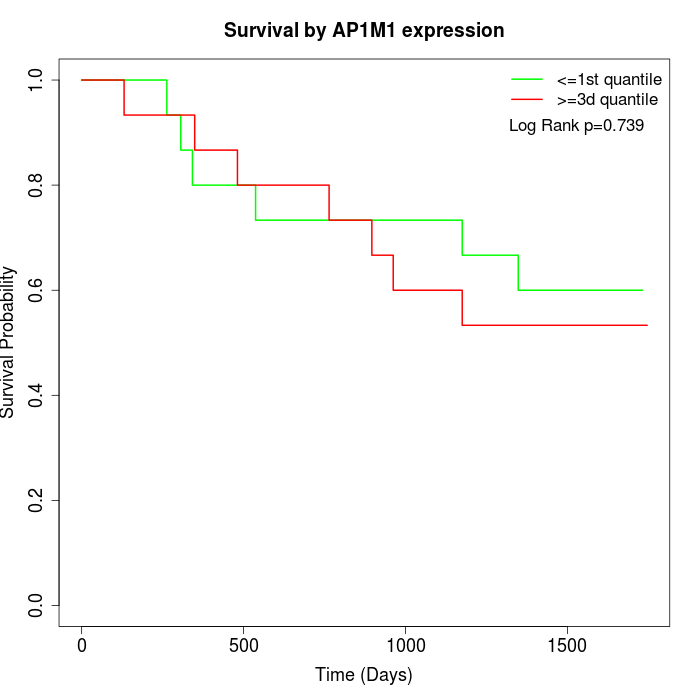 | 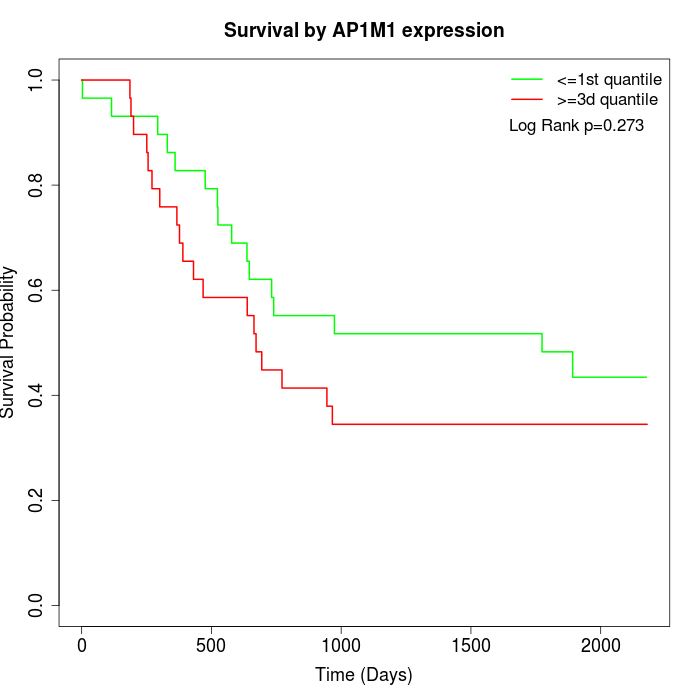 | 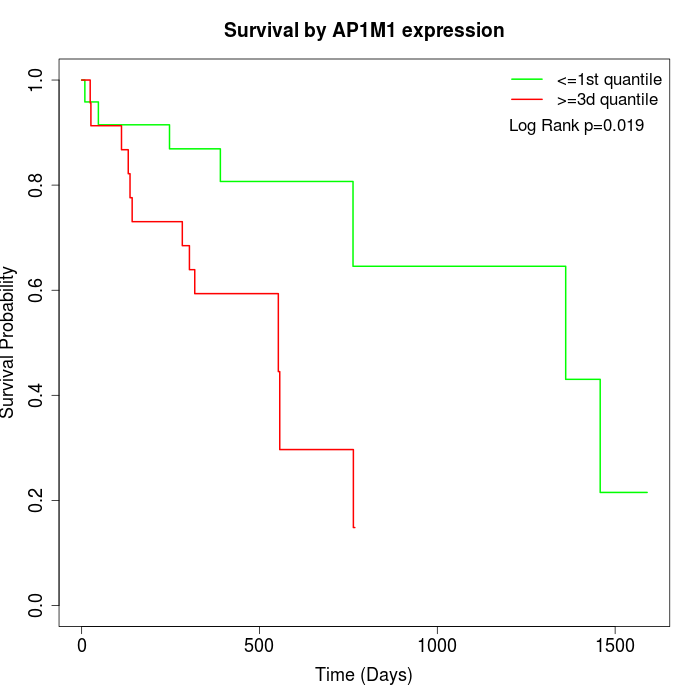 |
| GSE53622 | GSE53624 | TCGA |
Note: Click image to view full size file.
Copy number change of AP1M1:
| Dataset | Gene | EntrezID | Gain | Loss | Normal | Detail |
|---|---|---|---|---|---|---|
| GSE15526 | AP1M1 | 8907 | 4 | 3 | 23 | |
| GSE20123 | AP1M1 | 8907 | 3 | 2 | 25 | |
| GSE43470 | AP1M1 | 8907 | 2 | 6 | 35 | |
| GSE46452 | AP1M1 | 8907 | 47 | 1 | 11 | |
| GSE47630 | AP1M1 | 8907 | 4 | 8 | 28 | |
| GSE54993 | AP1M1 | 8907 | 15 | 4 | 51 | |
| GSE54994 | AP1M1 | 8907 | 6 | 14 | 33 | |
| GSE60625 | AP1M1 | 8907 | 9 | 0 | 2 | |
| GSE74703 | AP1M1 | 8907 | 2 | 4 | 30 | |
| GSE74704 | AP1M1 | 8907 | 0 | 1 | 19 | |
| TCGA | AP1M1 | 8907 | 18 | 9 | 69 |
Total number of gains: 110; Total number of losses: 52; Total Number of normals: 326.
Somatic mutations of AP1M1:
Generating mutation plots.
Highly correlated genes for AP1M1:
Showing top 20/392 corelated genes with mean PCC>0.5.
| Gene1 | Gene2 | Mean PCC | Num. Datasets | Num. PCC<0 | Num. PCC>0.5 |
|---|---|---|---|---|---|
| AP1M1 | TRAPPC6A | 0.730927 | 3 | 0 | 3 |
| AP1M1 | VKORC1 | 0.729037 | 5 | 0 | 5 |
| AP1M1 | CHCHD2 | 0.693004 | 3 | 0 | 3 |
| AP1M1 | KXD1 | 0.690566 | 6 | 0 | 6 |
| AP1M1 | RUNX1-IT1 | 0.687922 | 3 | 0 | 3 |
| AP1M1 | COPS7B | 0.685269 | 3 | 0 | 3 |
| AP1M1 | DNAJB2 | 0.665404 | 3 | 0 | 3 |
| AP1M1 | DOCK6 | 0.664979 | 4 | 0 | 3 |
| AP1M1 | FHOD1 | 0.664275 | 6 | 0 | 6 |
| AP1M1 | GADD45GIP1 | 0.66287 | 4 | 0 | 4 |
| AP1M1 | PLA2G15 | 0.662292 | 5 | 0 | 4 |
| AP1M1 | TPM3 | 0.662142 | 3 | 0 | 3 |
| AP1M1 | ADAMTS2 | 0.657059 | 6 | 0 | 6 |
| AP1M1 | COL5A3 | 0.654437 | 6 | 0 | 6 |
| AP1M1 | CNPY3 | 0.652138 | 4 | 0 | 3 |
| AP1M1 | FBXL12 | 0.651008 | 6 | 0 | 6 |
| AP1M1 | STK11 | 0.649957 | 3 | 0 | 3 |
| AP1M1 | APH1B | 0.645978 | 4 | 0 | 4 |
| AP1M1 | DPH2 | 0.64542 | 5 | 0 | 3 |
| AP1M1 | ANKRD52 | 0.643237 | 6 | 0 | 3 |
For details and further investigation, click here