| Full name: tropomyosin 3 | Alias Symbol: TRK | ||
| Type: protein-coding gene | Cytoband: 1q21.3 | ||
| Entrez ID: 7170 | HGNC ID: HGNC:12012 | Ensembl Gene: ENSG00000143549 | OMIM ID: 191030 |
| Related drugs: APAZIQUONE, CORTICOTROPIN, EPINEPHRINE, ETRETINATE, METHOTREXATE, MIDAZOLAM, PROGESTERONE, SIMVASTATIN, THIOGUANINE... [more] | |||
TPM3 involved pathways:
| KEGG pathway | Description | View |
|---|---|---|
| hsa04261 | Adrenergic signaling in cardiomyocytes | |
| hsa05200 | Pathways in cancer | |
| hsa05216 | Thyroid cancer |
Expression of TPM3:
| Dataset | Gene | EntrezID | Probe | Log2FC | Adj.pValue | Expression |
|---|---|---|---|---|---|---|
| GSE17351 | TPM3 | 7170 | 222976_s_at | 0.4570 | 0.1942 | |
| GSE20347 | TPM3 | 7170 | 214365_at | 0.0202 | 0.7866 | |
| GSE23400 | TPM3 | 7170 | 214365_at | 0.0185 | 0.6417 | |
| GSE26886 | TPM3 | 7170 | 222976_s_at | -0.3058 | 0.0558 | |
| GSE29001 | TPM3 | 7170 | 214365_at | -0.0689 | 0.4731 | |
| GSE38129 | TPM3 | 7170 | 214365_at | -0.0424 | 0.4595 | |
| GSE45670 | TPM3 | 7170 | 222976_s_at | 0.3453 | 0.0026 | |
| GSE53622 | TPM3 | 7170 | 105357 | 0.4987 | 0.0000 | |
| GSE53624 | TPM3 | 7170 | 105357 | 0.5855 | 0.0000 | |
| GSE63941 | TPM3 | 7170 | 222976_s_at | 0.3139 | 0.3742 | |
| GSE77861 | TPM3 | 7170 | 222976_s_at | 0.5165 | 0.0072 | |
| GSE97050 | TPM3 | 7170 | A_33_P3223980 | 0.8328 | 0.1344 | |
| SRP007169 | TPM3 | 7170 | RNAseq | 1.0432 | 0.0142 | |
| SRP008496 | TPM3 | 7170 | RNAseq | 1.0719 | 0.0002 | |
| SRP064894 | TPM3 | 7170 | RNAseq | 0.3355 | 0.0173 | |
| SRP133303 | TPM3 | 7170 | RNAseq | 0.6286 | 0.0001 | |
| SRP159526 | TPM3 | 7170 | RNAseq | 0.2892 | 0.1597 | |
| SRP193095 | TPM3 | 7170 | RNAseq | 0.1210 | 0.2699 | |
| SRP219564 | TPM3 | 7170 | RNAseq | 0.6198 | 0.1831 | |
| TCGA | TPM3 | 7170 | RNAseq | 0.1326 | 0.0011 |
Upregulated datasets: 2; Downregulated datasets: 0.
Survival by TPM3 expression:
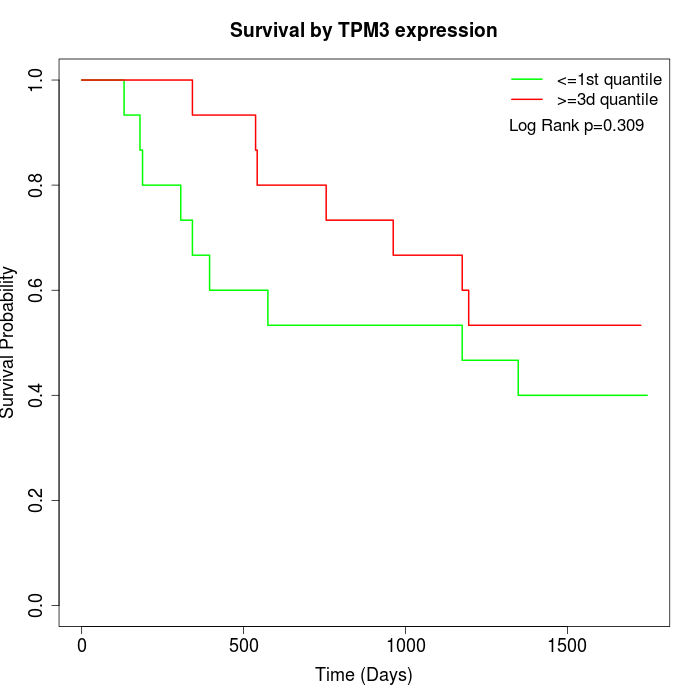 | 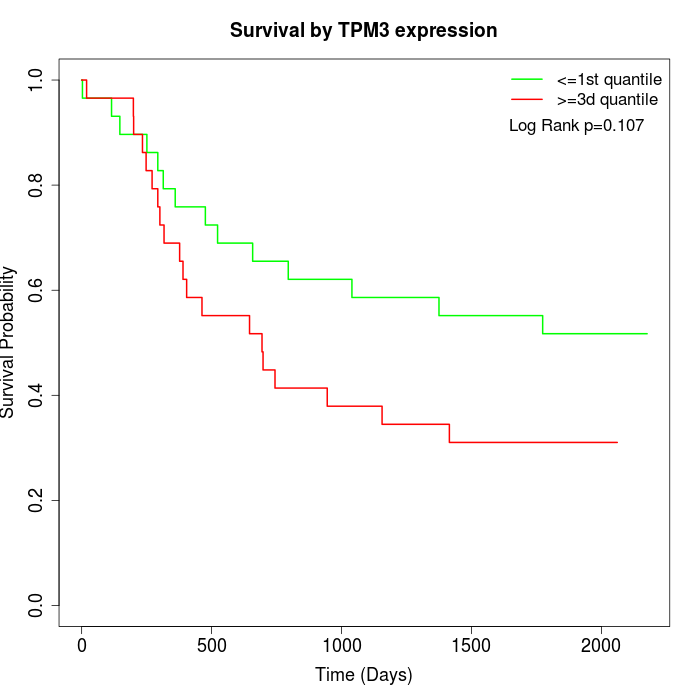 | 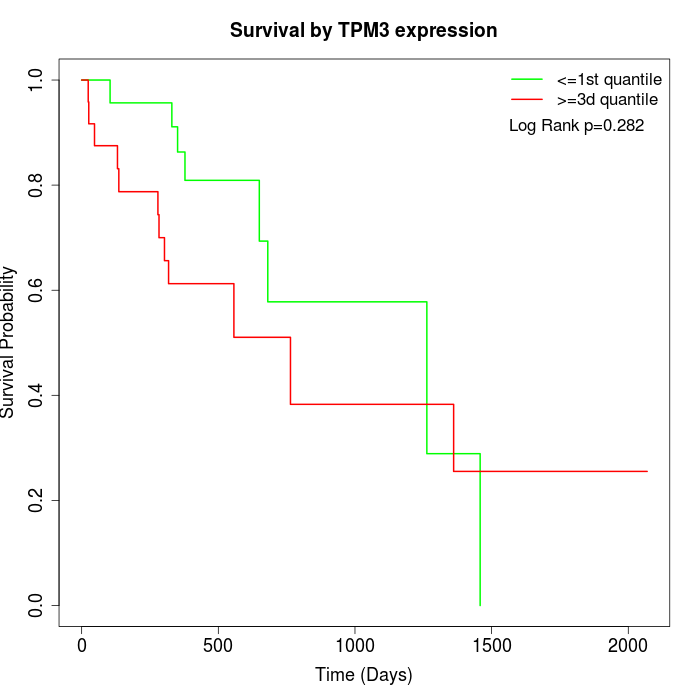 |
| GSE53622 | GSE53624 | TCGA |
Note: Click image to view full size file.
Copy number change of TPM3:
| Dataset | Gene | EntrezID | Gain | Loss | Normal | Detail |
|---|---|---|---|---|---|---|
| GSE15526 | TPM3 | 7170 | 14 | 0 | 16 | |
| GSE20123 | TPM3 | 7170 | 14 | 0 | 16 | |
| GSE43470 | TPM3 | 7170 | 7 | 2 | 34 | |
| GSE46452 | TPM3 | 7170 | 2 | 1 | 56 | |
| GSE47630 | TPM3 | 7170 | 14 | 0 | 26 | |
| GSE54993 | TPM3 | 7170 | 0 | 4 | 66 | |
| GSE54994 | TPM3 | 7170 | 16 | 0 | 37 | |
| GSE60625 | TPM3 | 7170 | 0 | 0 | 11 | |
| GSE74703 | TPM3 | 7170 | 6 | 1 | 29 | |
| GSE74704 | TPM3 | 7170 | 7 | 0 | 13 | |
| TCGA | TPM3 | 7170 | 38 | 2 | 56 |
Total number of gains: 118; Total number of losses: 10; Total Number of normals: 360.
Somatic mutations of TPM3:
Generating mutation plots.
Highly correlated genes for TPM3:
Showing top 20/772 corelated genes with mean PCC>0.5.
| Gene1 | Gene2 | Mean PCC | Num. Datasets | Num. PCC<0 | Num. PCC>0.5 |
|---|---|---|---|---|---|
| TPM3 | PSPC1 | 0.792541 | 3 | 0 | 3 |
| TPM3 | GTF3C4 | 0.754797 | 3 | 0 | 3 |
| TPM3 | PHF6 | 0.75395 | 3 | 0 | 3 |
| TPM3 | FAM89A | 0.752883 | 3 | 0 | 3 |
| TPM3 | RPN1 | 0.751942 | 6 | 0 | 6 |
| TPM3 | MAP4K4 | 0.747174 | 4 | 0 | 4 |
| TPM3 | CDH3 | 0.742496 | 4 | 0 | 4 |
| TPM3 | DERL1 | 0.738634 | 4 | 0 | 4 |
| TPM3 | EI24 | 0.735817 | 3 | 0 | 3 |
| TPM3 | SKA1 | 0.729912 | 6 | 0 | 6 |
| TPM3 | PARVB | 0.728857 | 3 | 0 | 3 |
| TPM3 | XPO6 | 0.728735 | 5 | 0 | 5 |
| TPM3 | AASDHPPT | 0.725583 | 3 | 0 | 3 |
| TPM3 | ZNF267 | 0.723877 | 3 | 0 | 3 |
| TPM3 | CELSR2 | 0.723254 | 3 | 0 | 3 |
| TPM3 | DCBLD1 | 0.720708 | 6 | 0 | 6 |
| TPM3 | ELF4 | 0.719633 | 6 | 0 | 5 |
| TPM3 | LEPROTL1 | 0.719362 | 3 | 0 | 3 |
| TPM3 | MELK | 0.715491 | 7 | 0 | 6 |
| TPM3 | FAM49B | 0.712693 | 6 | 0 | 5 |
For details and further investigation, click here