| Full name: adaptor related protein complex 2 subunit alpha 1 | Alias Symbol: | ||
| Type: protein-coding gene | Cytoband: 19q13.33 | ||
| Entrez ID: 160 | HGNC ID: HGNC:561 | Ensembl Gene: ENSG00000196961 | OMIM ID: 601026 |
Screen Evidence:
| |||
AP2A1 involved pathways:
| KEGG pathway | Description | View |
|---|---|---|
| hsa05016 | Huntington's disease |
Expression of AP2A1:
| Dataset | Gene | EntrezID | Probe | Log2FC | Adj.pValue | Expression |
|---|---|---|---|---|---|---|
| GSE17351 | AP2A1 | 160 | 223237_x_at | 0.4331 | 0.0992 | |
| GSE26886 | AP2A1 | 160 | 229617_x_at | 0.3304 | 0.0443 | |
| GSE45670 | AP2A1 | 160 | 1558792_x_at | 0.1451 | 0.2920 | |
| GSE53622 | AP2A1 | 160 | 17469 | 0.1096 | 0.0701 | |
| GSE53624 | AP2A1 | 160 | 3939 | 0.0893 | 0.4631 | |
| GSE63941 | AP2A1 | 160 | 223237_x_at | 0.7306 | 0.0040 | |
| GSE77861 | AP2A1 | 160 | 223237_x_at | 0.0805 | 0.7723 | |
| GSE97050 | AP2A1 | 160 | A_23_P4885 | 0.1163 | 0.6542 | |
| SRP007169 | AP2A1 | 160 | RNAseq | -0.8129 | 0.0340 | |
| SRP008496 | AP2A1 | 160 | RNAseq | -0.9911 | 0.0001 | |
| SRP064894 | AP2A1 | 160 | RNAseq | 0.2292 | 0.1183 | |
| SRP133303 | AP2A1 | 160 | RNAseq | 0.0032 | 0.9875 | |
| SRP159526 | AP2A1 | 160 | RNAseq | -0.0197 | 0.9495 | |
| SRP193095 | AP2A1 | 160 | RNAseq | 0.0732 | 0.5457 | |
| SRP219564 | AP2A1 | 160 | RNAseq | 0.0638 | 0.7921 | |
| TCGA | AP2A1 | 160 | RNAseq | 0.0517 | 0.2248 |
Upregulated datasets: 0; Downregulated datasets: 0.
Survival by AP2A1 expression:
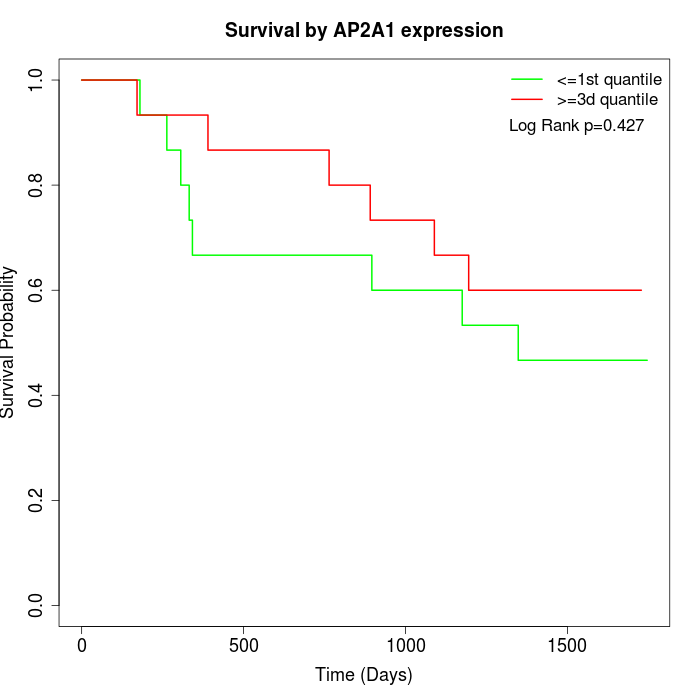 | 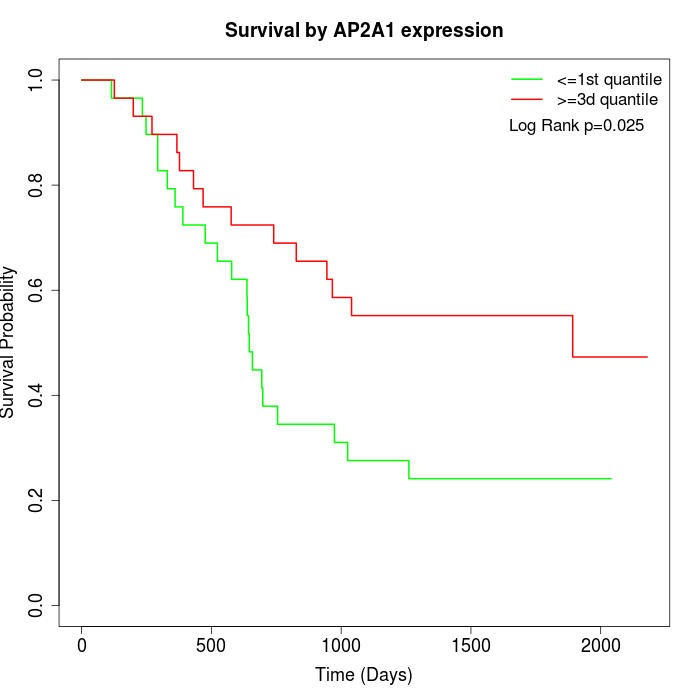 | 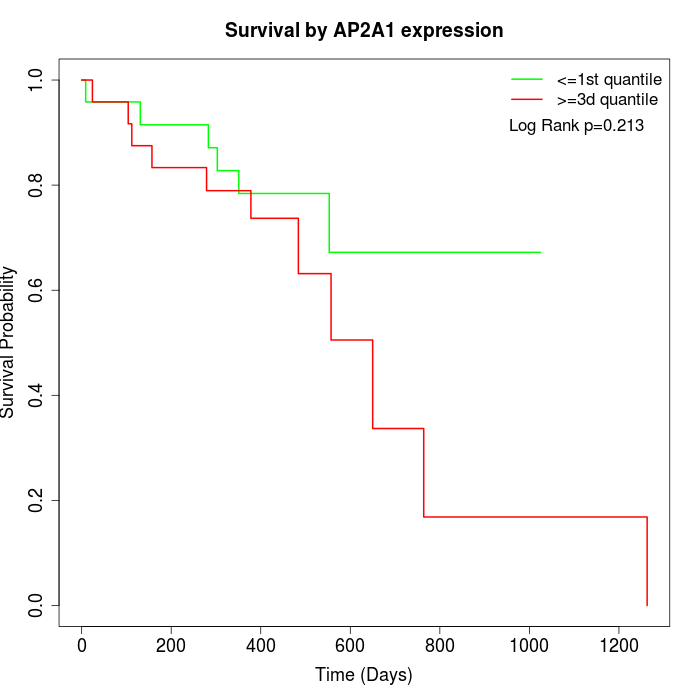 |
| GSE53622 | GSE53624 | TCGA |
Note: Click image to view full size file.
Copy number change of AP2A1:
| Dataset | Gene | EntrezID | Gain | Loss | Normal | Detail |
|---|---|---|---|---|---|---|
| GSE15526 | AP2A1 | 160 | 4 | 4 | 22 | |
| GSE20123 | AP2A1 | 160 | 4 | 3 | 23 | |
| GSE43470 | AP2A1 | 160 | 5 | 11 | 27 | |
| GSE46452 | AP2A1 | 160 | 45 | 1 | 13 | |
| GSE47630 | AP2A1 | 160 | 10 | 6 | 24 | |
| GSE54993 | AP2A1 | 160 | 17 | 4 | 49 | |
| GSE54994 | AP2A1 | 160 | 4 | 14 | 35 | |
| GSE60625 | AP2A1 | 160 | 9 | 0 | 2 | |
| GSE74703 | AP2A1 | 160 | 5 | 7 | 24 | |
| GSE74704 | AP2A1 | 160 | 4 | 1 | 15 | |
| TCGA | AP2A1 | 160 | 14 | 18 | 64 |
Total number of gains: 121; Total number of losses: 69; Total Number of normals: 298.
Somatic mutations of AP2A1:
Generating mutation plots.
Highly correlated genes for AP2A1:
Showing top 20/413 corelated genes with mean PCC>0.5.
| Gene1 | Gene2 | Mean PCC | Num. Datasets | Num. PCC<0 | Num. PCC>0.5 |
|---|---|---|---|---|---|
| AP2A1 | MEX3D | 0.734184 | 3 | 0 | 3 |
| AP2A1 | NR2C2AP | 0.72059 | 3 | 0 | 3 |
| AP2A1 | GSK3A | 0.719579 | 4 | 0 | 4 |
| AP2A1 | SKIV2L | 0.718668 | 3 | 0 | 3 |
| AP2A1 | LDB1 | 0.717296 | 3 | 0 | 3 |
| AP2A1 | PMPCA | 0.713292 | 3 | 0 | 3 |
| AP2A1 | EPN1 | 0.70862 | 4 | 0 | 4 |
| AP2A1 | CBS | 0.707513 | 3 | 0 | 3 |
| AP2A1 | PFN1 | 0.707386 | 4 | 0 | 4 |
| AP2A1 | ZNF316 | 0.704307 | 4 | 0 | 3 |
| AP2A1 | CDK18 | 0.696272 | 4 | 0 | 4 |
| AP2A1 | ZNF683 | 0.696252 | 4 | 0 | 4 |
| AP2A1 | MAPK15 | 0.695845 | 3 | 0 | 3 |
| AP2A1 | ATAD3A | 0.69404 | 5 | 0 | 4 |
| AP2A1 | CNOT3 | 0.689601 | 5 | 0 | 4 |
| AP2A1 | TIGD5 | 0.68838 | 3 | 0 | 3 |
| AP2A1 | FIZ1 | 0.687346 | 3 | 0 | 3 |
| AP2A1 | NPHP4 | 0.683848 | 3 | 0 | 3 |
| AP2A1 | ATAD3B | 0.683109 | 4 | 0 | 3 |
| AP2A1 | SIK1 | 0.682071 | 3 | 0 | 3 |
For details and further investigation, click here