| Full name: profilin 1 | Alias Symbol: | ||
| Type: protein-coding gene | Cytoband: 17p13.2 | ||
| Entrez ID: 5216 | HGNC ID: HGNC:8881 | Ensembl Gene: ENSG00000108518 | OMIM ID: 176610 |
Screen Evidence:
| |||
PFN1 involved pathways:
| KEGG pathway | Description | View |
|---|---|---|
| hsa04015 | Rap1 signaling pathway | |
| hsa04810 | Regulation of actin cytoskeleton | |
| hsa05132 | Salmonella infection |
Expression of PFN1:
| Dataset | Gene | EntrezID | Probe | Log2FC | Adj.pValue | Expression |
|---|---|---|---|---|---|---|
| GSE17351 | PFN1 | 5216 | 200634_at | 0.3811 | 0.0799 | |
| GSE20347 | PFN1 | 5216 | 200634_at | 0.1875 | 0.2551 | |
| GSE23400 | PFN1 | 5216 | 200634_at | 0.4635 | 0.0000 | |
| GSE26886 | PFN1 | 5216 | 200634_at | -0.3059 | 0.4797 | |
| GSE29001 | PFN1 | 5216 | 200634_at | 0.2325 | 0.8240 | |
| GSE38129 | PFN1 | 5216 | 200634_at | 0.2185 | 0.2060 | |
| GSE45670 | PFN1 | 5216 | 200634_at | 0.1144 | 0.6296 | |
| GSE63941 | PFN1 | 5216 | 200634_at | 2.3474 | 0.0000 | |
| GSE77861 | PFN1 | 5216 | 200634_at | 0.3035 | 0.3408 | |
| GSE97050 | PFN1 | 5216 | A_32_P234604 | 0.6622 | 0.1090 | |
| SRP007169 | PFN1 | 5216 | RNAseq | -0.0962 | 0.7555 | |
| SRP008496 | PFN1 | 5216 | RNAseq | -0.1360 | 0.4581 | |
| SRP064894 | PFN1 | 5216 | RNAseq | 0.9593 | 0.0004 | |
| SRP133303 | PFN1 | 5216 | RNAseq | 0.3069 | 0.0263 | |
| SRP159526 | PFN1 | 5216 | RNAseq | 0.2043 | 0.3695 | |
| SRP193095 | PFN1 | 5216 | RNAseq | 0.1905 | 0.2022 | |
| SRP219564 | PFN1 | 5216 | RNAseq | 0.3706 | 0.4071 | |
| TCGA | PFN1 | 5216 | RNAseq | 0.1648 | 0.0002 |
Upregulated datasets: 1; Downregulated datasets: 0.
Survival by PFN1 expression:
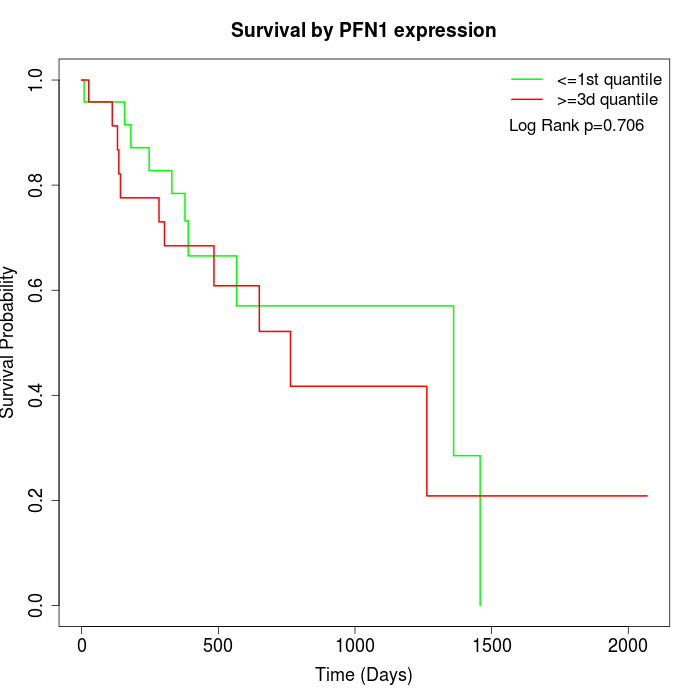 |
| TCGA |
Note: Click image to view full size file.
Copy number change of PFN1:
| Dataset | Gene | EntrezID | Gain | Loss | Normal | Detail |
|---|---|---|---|---|---|---|
| GSE15526 | PFN1 | 5216 | 5 | 2 | 23 | |
| GSE20123 | PFN1 | 5216 | 5 | 3 | 22 | |
| GSE43470 | PFN1 | 5216 | 1 | 6 | 36 | |
| GSE46452 | PFN1 | 5216 | 34 | 1 | 24 | |
| GSE47630 | PFN1 | 5216 | 7 | 1 | 32 | |
| GSE54993 | PFN1 | 5216 | 4 | 3 | 63 | |
| GSE54994 | PFN1 | 5216 | 5 | 9 | 39 | |
| GSE60625 | PFN1 | 5216 | 4 | 0 | 7 | |
| GSE74703 | PFN1 | 5216 | 1 | 3 | 32 | |
| GSE74704 | PFN1 | 5216 | 3 | 1 | 16 | |
| TCGA | PFN1 | 5216 | 18 | 21 | 57 |
Total number of gains: 87; Total number of losses: 50; Total Number of normals: 351.
Somatic mutations of PFN1:
Generating mutation plots.
Highly correlated genes for PFN1:
Showing top 20/819 corelated genes with mean PCC>0.5.
| Gene1 | Gene2 | Mean PCC | Num. Datasets | Num. PCC<0 | Num. PCC>0.5 |
|---|---|---|---|---|---|
| PFN1 | CNTROB | 0.840511 | 4 | 0 | 4 |
| PFN1 | PHLDA3 | 0.774425 | 3 | 0 | 3 |
| PFN1 | TP53I13 | 0.772019 | 3 | 0 | 3 |
| PFN1 | PYGO2 | 0.758333 | 3 | 0 | 3 |
| PFN1 | CMTM4 | 0.74337 | 3 | 0 | 3 |
| PFN1 | CCM2 | 0.735592 | 3 | 0 | 3 |
| PFN1 | SAMD1 | 0.732458 | 4 | 0 | 4 |
| PFN1 | MED9 | 0.712036 | 4 | 0 | 4 |
| PFN1 | USP5 | 0.71057 | 4 | 0 | 4 |
| PFN1 | AP2A1 | 0.707386 | 4 | 0 | 4 |
| PFN1 | SPTAN1 | 0.702874 | 5 | 0 | 4 |
| PFN1 | GRINA | 0.70221 | 6 | 0 | 4 |
| PFN1 | PKM | 0.696165 | 7 | 0 | 6 |
| PFN1 | LSR | 0.695192 | 5 | 0 | 4 |
| PFN1 | BCL7A | 0.693961 | 4 | 0 | 4 |
| PFN1 | MOB3A | 0.691863 | 3 | 0 | 3 |
| PFN1 | AGRN | 0.691374 | 6 | 0 | 6 |
| PFN1 | MIER2 | 0.689836 | 4 | 0 | 4 |
| PFN1 | MSTO1 | 0.681212 | 3 | 0 | 3 |
| PFN1 | SLC25A11 | 0.680498 | 9 | 0 | 9 |
For details and further investigation, click here