| Full name: adaptor related protein complex 3 subunit sigma 1 | Alias Symbol: | ||
| Type: protein-coding gene | Cytoband: 5q22.3-q23.1 | ||
| Entrez ID: 1176 | HGNC ID: HGNC:2013 | Ensembl Gene: ENSG00000177879 | OMIM ID: 601507 |
Screen Evidence:
| |||
Expression of AP3S1:
| Dataset | Gene | EntrezID | Probe | Log2FC | Adj.pValue | Expression |
|---|---|---|---|---|---|---|
| GSE17351 | AP3S1 | 1176 | 202442_at | -0.4056 | 0.4574 | |
| GSE20347 | AP3S1 | 1176 | 202442_at | -0.5981 | 0.0001 | |
| GSE23400 | AP3S1 | 1176 | 202442_at | -0.2839 | 0.0000 | |
| GSE26886 | AP3S1 | 1176 | 202442_at | -0.5955 | 0.0041 | |
| GSE29001 | AP3S1 | 1176 | 202442_at | -0.2892 | 0.1625 | |
| GSE38129 | AP3S1 | 1176 | 202442_at | -0.5635 | 0.0000 | |
| GSE45670 | AP3S1 | 1176 | 202442_at | -0.2950 | 0.0964 | |
| GSE53622 | AP3S1 | 1176 | 77508 | -0.5494 | 0.0000 | |
| GSE53624 | AP3S1 | 1176 | 77508 | -0.3778 | 0.0000 | |
| GSE63941 | AP3S1 | 1176 | 202442_at | -0.6124 | 0.2512 | |
| GSE77861 | AP3S1 | 1176 | 202442_at | -0.7852 | 0.0053 | |
| GSE97050 | AP3S1 | 1176 | A_23_P69958 | -0.0538 | 0.8667 | |
| SRP007169 | AP3S1 | 1176 | RNAseq | -1.9297 | 0.0000 | |
| SRP008496 | AP3S1 | 1176 | RNAseq | -1.6504 | 0.0000 | |
| SRP064894 | AP3S1 | 1176 | RNAseq | -0.4955 | 0.0044 | |
| SRP133303 | AP3S1 | 1176 | RNAseq | -0.0163 | 0.9394 | |
| SRP159526 | AP3S1 | 1176 | RNAseq | -0.7587 | 0.0375 | |
| SRP193095 | AP3S1 | 1176 | RNAseq | -1.0926 | 0.0000 | |
| SRP219564 | AP3S1 | 1176 | RNAseq | -0.6184 | 0.1173 | |
| TCGA | AP3S1 | 1176 | RNAseq | 0.0697 | 0.2593 |
Upregulated datasets: 0; Downregulated datasets: 3.
Survival by AP3S1 expression:
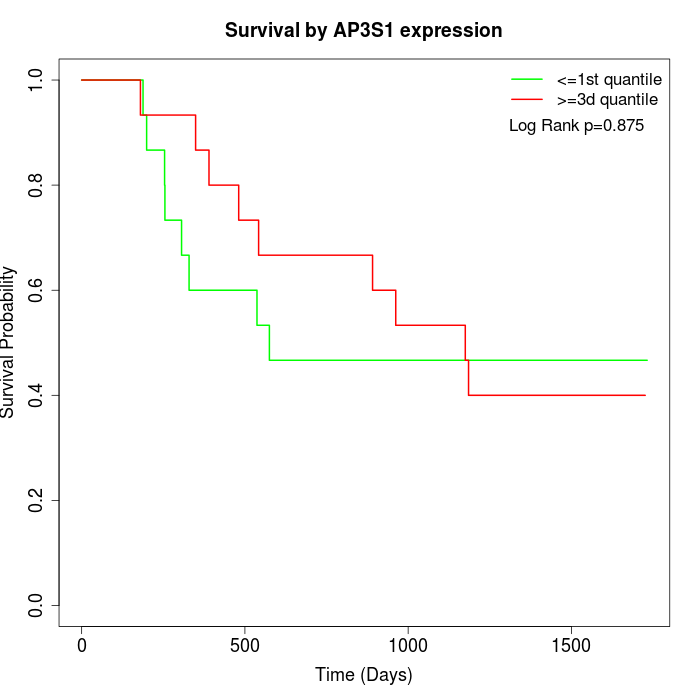 | 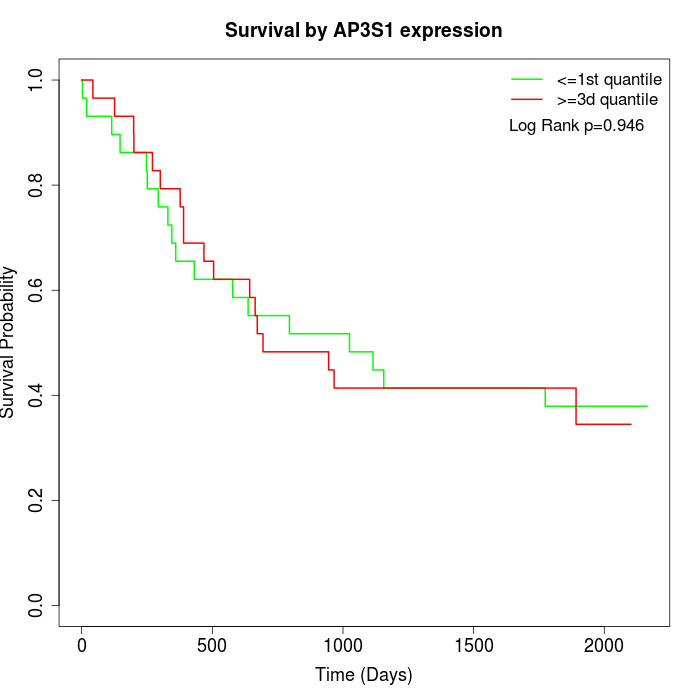 | 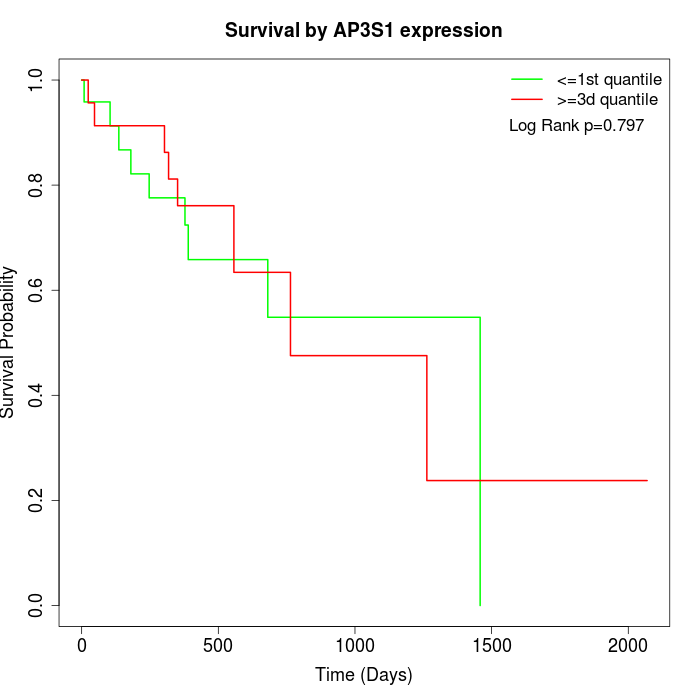 |
| GSE53622 | GSE53624 | TCGA |
Note: Click image to view full size file.
Copy number change of AP3S1:
| Dataset | Gene | EntrezID | Gain | Loss | Normal | Detail |
|---|---|---|---|---|---|---|
| GSE15526 | AP3S1 | 1176 | 1 | 13 | 16 | |
| GSE20123 | AP3S1 | 1176 | 1 | 13 | 16 | |
| GSE43470 | AP3S1 | 1176 | 3 | 8 | 32 | |
| GSE46452 | AP3S1 | 1176 | 0 | 28 | 31 | |
| GSE47630 | AP3S1 | 1176 | 0 | 21 | 19 | |
| GSE54993 | AP3S1 | 1176 | 9 | 1 | 60 | |
| GSE54994 | AP3S1 | 1176 | 1 | 15 | 37 | |
| GSE60625 | AP3S1 | 1176 | 0 | 0 | 11 | |
| GSE74703 | AP3S1 | 1176 | 2 | 6 | 28 | |
| GSE74704 | AP3S1 | 1176 | 1 | 7 | 12 | |
| TCGA | AP3S1 | 1176 | 2 | 41 | 53 |
Total number of gains: 20; Total number of losses: 153; Total Number of normals: 315.
Somatic mutations of AP3S1:
Generating mutation plots.
Highly correlated genes for AP3S1:
Showing top 20/969 corelated genes with mean PCC>0.5.
| Gene1 | Gene2 | Mean PCC | Num. Datasets | Num. PCC<0 | Num. PCC>0.5 |
|---|---|---|---|---|---|
| AP3S1 | GPBP1 | 0.801003 | 3 | 0 | 3 |
| AP3S1 | TMEM234 | 0.733572 | 3 | 0 | 3 |
| AP3S1 | SHISA5 | 0.729466 | 3 | 0 | 3 |
| AP3S1 | ROBO1 | 0.712143 | 3 | 0 | 3 |
| AP3S1 | TMEM38A | 0.71147 | 3 | 0 | 3 |
| AP3S1 | ATG12 | 0.711039 | 7 | 0 | 6 |
| AP3S1 | APEH | 0.70675 | 5 | 0 | 5 |
| AP3S1 | MOB3B | 0.70576 | 3 | 0 | 3 |
| AP3S1 | TAX1BP3 | 0.703177 | 3 | 0 | 3 |
| AP3S1 | COG6 | 0.69878 | 3 | 0 | 3 |
| AP3S1 | SETD2 | 0.698065 | 3 | 0 | 3 |
| AP3S1 | SUB1 | 0.696841 | 3 | 0 | 3 |
| AP3S1 | ELOVL1 | 0.696727 | 3 | 0 | 3 |
| AP3S1 | EXOC6B | 0.691885 | 3 | 0 | 3 |
| AP3S1 | GNG12 | 0.687468 | 13 | 0 | 13 |
| AP3S1 | MEGF6 | 0.684512 | 3 | 0 | 3 |
| AP3S1 | CLTA | 0.680821 | 3 | 0 | 3 |
| AP3S1 | DCP2 | 0.680395 | 3 | 0 | 3 |
| AP3S1 | UBLCP1 | 0.680251 | 4 | 0 | 4 |
| AP3S1 | EVC2 | 0.676941 | 3 | 0 | 3 |
For details and further investigation, click here