| Full name: actin binding LIM protein 1 | Alias Symbol: abLIM|limatin | ||
| Type: protein-coding gene | Cytoband: 10q25.3 | ||
| Entrez ID: 3983 | HGNC ID: HGNC:78 | Ensembl Gene: ENSG00000099204 | OMIM ID: 602330 |
ABLIM1 involved pathways:
| KEGG pathway | Description | View |
|---|---|---|
| hsa04360 | Axon guidance |
Expression of ABLIM1:
| Dataset | Gene | EntrezID | Probe | Log2FC | Adj.pValue | Expression |
|---|---|---|---|---|---|---|
| GSE17351 | ABLIM1 | 3983 | 200965_s_at | -1.2920 | 0.0366 | |
| GSE20347 | ABLIM1 | 3983 | 200965_s_at | -2.5093 | 0.0000 | |
| GSE23400 | ABLIM1 | 3983 | 200965_s_at | -2.0333 | 0.0000 | |
| GSE26886 | ABLIM1 | 3983 | 200965_s_at | -3.0717 | 0.0000 | |
| GSE29001 | ABLIM1 | 3983 | 200965_s_at | -2.0223 | 0.0000 | |
| GSE38129 | ABLIM1 | 3983 | 200965_s_at | -2.1766 | 0.0000 | |
| GSE45670 | ABLIM1 | 3983 | 200965_s_at | -1.0088 | 0.0024 | |
| GSE53622 | ABLIM1 | 3983 | 46540 | -2.4540 | 0.0000 | |
| GSE53624 | ABLIM1 | 3983 | 46540 | -2.3523 | 0.0000 | |
| GSE63941 | ABLIM1 | 3983 | 200965_s_at | 2.6448 | 0.0229 | |
| GSE77861 | ABLIM1 | 3983 | 200965_s_at | -1.2674 | 0.0026 | |
| GSE97050 | ABLIM1 | 3983 | A_33_P3388651 | -1.0726 | 0.0959 | |
| SRP007169 | ABLIM1 | 3983 | RNAseq | -2.6156 | 0.0000 | |
| SRP008496 | ABLIM1 | 3983 | RNAseq | -3.0172 | 0.0000 | |
| SRP064894 | ABLIM1 | 3983 | RNAseq | -2.7032 | 0.0000 | |
| SRP133303 | ABLIM1 | 3983 | RNAseq | -2.1870 | 0.0000 | |
| SRP159526 | ABLIM1 | 3983 | RNAseq | -2.3535 | 0.0017 | |
| SRP193095 | ABLIM1 | 3983 | RNAseq | -2.2807 | 0.0000 | |
| SRP219564 | ABLIM1 | 3983 | RNAseq | -2.5127 | 0.0000 | |
| TCGA | ABLIM1 | 3983 | RNAseq | -0.3699 | 0.0000 |
Upregulated datasets: 1; Downregulated datasets: 17.
Survival by ABLIM1 expression:
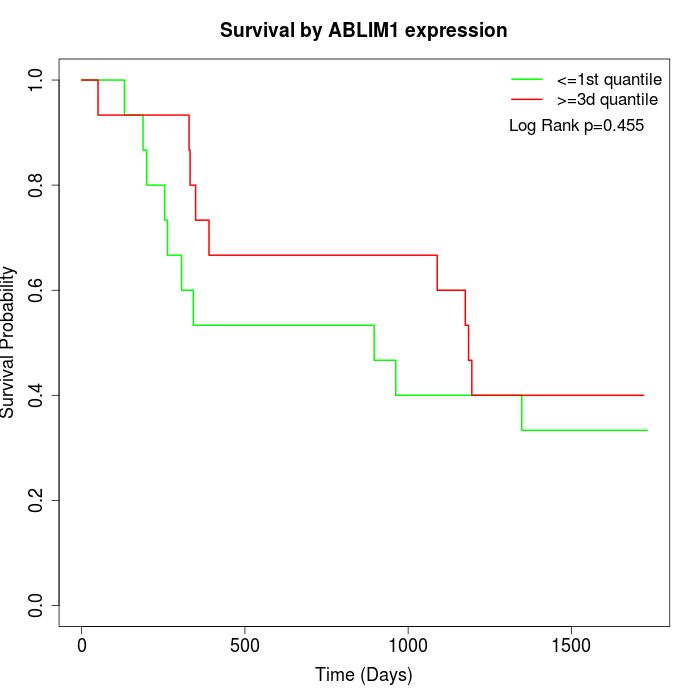 | 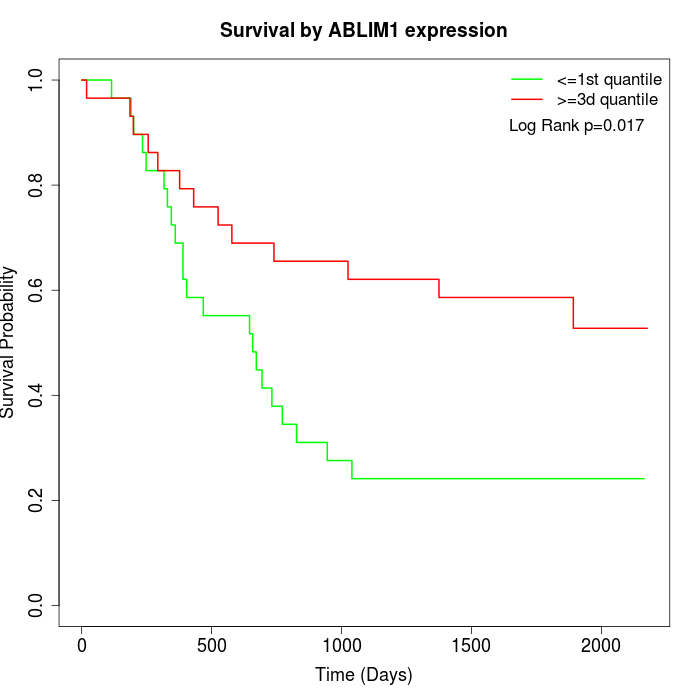 | 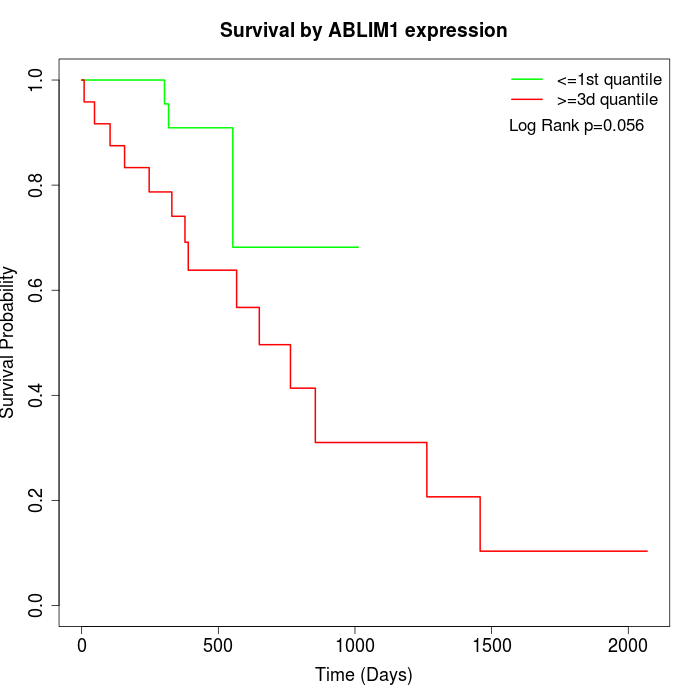 |
| GSE53622 | GSE53624 | TCGA |
Note: Click image to view full size file.
Copy number change of ABLIM1:
| Dataset | Gene | EntrezID | Gain | Loss | Normal | Detail |
|---|---|---|---|---|---|---|
| GSE15526 | ABLIM1 | 3983 | 2 | 8 | 20 | |
| GSE20123 | ABLIM1 | 3983 | 2 | 7 | 21 | |
| GSE43470 | ABLIM1 | 3983 | 0 | 9 | 34 | |
| GSE46452 | ABLIM1 | 3983 | 0 | 11 | 48 | |
| GSE47630 | ABLIM1 | 3983 | 2 | 14 | 24 | |
| GSE54993 | ABLIM1 | 3983 | 8 | 0 | 62 | |
| GSE54994 | ABLIM1 | 3983 | 1 | 9 | 43 | |
| GSE60625 | ABLIM1 | 3983 | 0 | 0 | 11 | |
| GSE74703 | ABLIM1 | 3983 | 0 | 6 | 30 | |
| GSE74704 | ABLIM1 | 3983 | 1 | 3 | 16 | |
| TCGA | ABLIM1 | 3983 | 4 | 28 | 64 |
Total number of gains: 20; Total number of losses: 95; Total Number of normals: 373.
Somatic mutations of ABLIM1:
Generating mutation plots.
Highly correlated genes for ABLIM1:
Showing top 20/1622 corelated genes with mean PCC>0.5.
| Gene1 | Gene2 | Mean PCC | Num. Datasets | Num. PCC<0 | Num. PCC>0.5 |
|---|---|---|---|---|---|
| ABLIM1 | SASH1 | 0.900481 | 11 | 0 | 11 |
| ABLIM1 | KRT78 | 0.887365 | 7 | 0 | 7 |
| ABLIM1 | FAM214A | 0.879414 | 6 | 0 | 6 |
| ABLIM1 | CRISP3 | 0.867495 | 11 | 0 | 11 |
| ABLIM1 | SH3BGRL2 | 0.863061 | 7 | 0 | 7 |
| ABLIM1 | CHP1 | 0.861028 | 10 | 0 | 10 |
| ABLIM1 | EPS8L2 | 0.858789 | 10 | 0 | 10 |
| ABLIM1 | FCHO2 | 0.851417 | 7 | 0 | 7 |
| ABLIM1 | FAM3B | 0.849917 | 6 | 0 | 6 |
| ABLIM1 | RAB11A | 0.845438 | 11 | 0 | 11 |
| ABLIM1 | SFTA2 | 0.845213 | 4 | 0 | 4 |
| ABLIM1 | ANXA9 | 0.844322 | 11 | 0 | 11 |
| ABLIM1 | MAL | 0.841867 | 11 | 0 | 11 |
| ABLIM1 | ENDOU | 0.839934 | 12 | 0 | 11 |
| ABLIM1 | CRNN | 0.838345 | 11 | 0 | 11 |
| ABLIM1 | CYP2C18 | 0.836409 | 11 | 0 | 10 |
| ABLIM1 | CXCR2 | 0.83595 | 11 | 0 | 11 |
| ABLIM1 | GYS2 | 0.833259 | 10 | 0 | 10 |
| ABLIM1 | ATG9B | 0.828515 | 7 | 0 | 7 |
| ABLIM1 | GDPD3 | 0.824343 | 12 | 0 | 11 |
For details and further investigation, click here