| Full name: beta-1,3-glucuronyltransferase 2 | Alias Symbol: GlcAT-S | ||
| Type: protein-coding gene | Cytoband: 6q13 | ||
| Entrez ID: 135152 | HGNC ID: HGNC:922 | Ensembl Gene: ENSG00000112309 | OMIM ID: 607497 |
Expression of B3GAT2:
| Dataset | Gene | EntrezID | Probe | Log2FC | Adj.pValue | Expression |
|---|---|---|---|---|---|---|
| GSE17351 | B3GAT2 | 135152 | 239144_at | -0.4411 | 0.5119 | |
| GSE26886 | B3GAT2 | 135152 | 239144_at | -0.4720 | 0.0417 | |
| GSE45670 | B3GAT2 | 135152 | 239144_at | -0.4430 | 0.0073 | |
| GSE53622 | B3GAT2 | 135152 | 73202 | -0.6294 | 0.0000 | |
| GSE53624 | B3GAT2 | 135152 | 73202 | -0.6024 | 0.0000 | |
| GSE63941 | B3GAT2 | 135152 | 239144_at | 0.8164 | 0.0249 | |
| GSE77861 | B3GAT2 | 135152 | 239144_at | -0.1055 | 0.3888 | |
| GSE97050 | B3GAT2 | 135152 | A_23_P167805 | -0.7241 | 0.0705 | |
| SRP133303 | B3GAT2 | 135152 | RNAseq | -0.2772 | 0.1275 | |
| SRP159526 | B3GAT2 | 135152 | RNAseq | -0.1292 | 0.7719 | |
| SRP193095 | B3GAT2 | 135152 | RNAseq | -0.8642 | 0.0000 | |
| SRP219564 | B3GAT2 | 135152 | RNAseq | -0.1886 | 0.7299 | |
| TCGA | B3GAT2 | 135152 | RNAseq | -0.5236 | 0.0212 |
Upregulated datasets: 0; Downregulated datasets: 0.
Survival by B3GAT2 expression:
 | 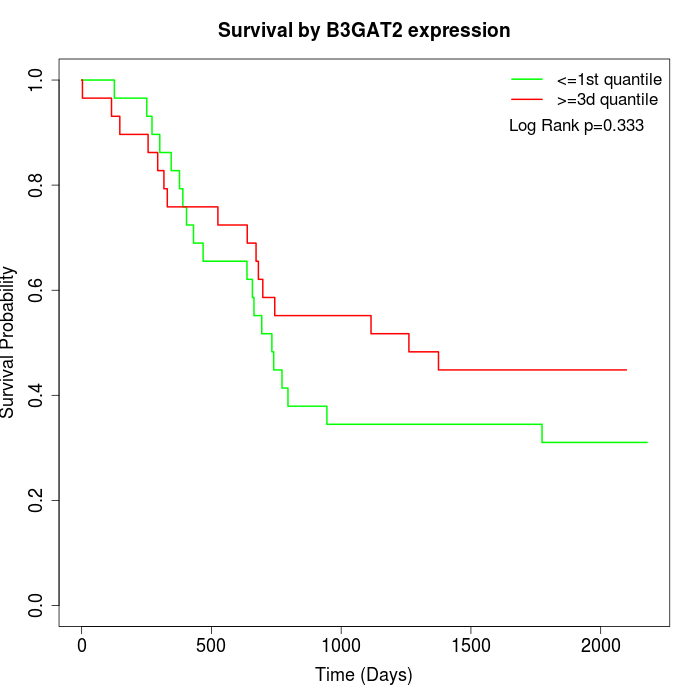 | 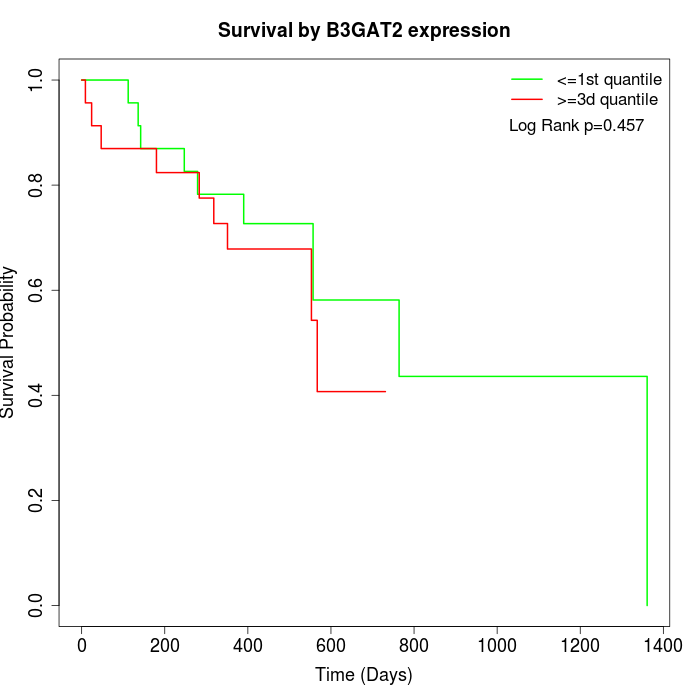 |
| GSE53622 | GSE53624 | TCGA |
Note: Click image to view full size file.
Copy number change of B3GAT2:
| Dataset | Gene | EntrezID | Gain | Loss | Normal | Detail |
|---|---|---|---|---|---|---|
| GSE15526 | B3GAT2 | 135152 | 2 | 2 | 26 | |
| GSE20123 | B3GAT2 | 135152 | 2 | 1 | 27 | |
| GSE43470 | B3GAT2 | 135152 | 3 | 0 | 40 | |
| GSE46452 | B3GAT2 | 135152 | 2 | 11 | 46 | |
| GSE47630 | B3GAT2 | 135152 | 8 | 4 | 28 | |
| GSE54993 | B3GAT2 | 135152 | 3 | 2 | 65 | |
| GSE54994 | B3GAT2 | 135152 | 9 | 5 | 39 | |
| GSE60625 | B3GAT2 | 135152 | 0 | 2 | 9 | |
| GSE74703 | B3GAT2 | 135152 | 3 | 0 | 33 | |
| GSE74704 | B3GAT2 | 135152 | 0 | 1 | 19 | |
| TCGA | B3GAT2 | 135152 | 11 | 19 | 66 |
Total number of gains: 43; Total number of losses: 47; Total Number of normals: 398.
Somatic mutations of B3GAT2:
Generating mutation plots.
Highly correlated genes for B3GAT2:
Showing top 20/111 corelated genes with mean PCC>0.5.
| Gene1 | Gene2 | Mean PCC | Num. Datasets | Num. PCC<0 | Num. PCC>0.5 |
|---|---|---|---|---|---|
| B3GAT2 | MTA3 | 0.754933 | 3 | 0 | 3 |
| B3GAT2 | PDZRN4 | 0.746725 | 3 | 0 | 3 |
| B3GAT2 | MAP2K7 | 0.73878 | 3 | 0 | 3 |
| B3GAT2 | VPS13A | 0.712713 | 3 | 0 | 3 |
| B3GAT2 | PRKAG1 | 0.711304 | 3 | 0 | 3 |
| B3GAT2 | HEXIM1 | 0.700052 | 3 | 0 | 3 |
| B3GAT2 | SMYD1 | 0.693833 | 3 | 0 | 3 |
| B3GAT2 | DNHD1 | 0.688885 | 3 | 0 | 3 |
| B3GAT2 | B3GNT2 | 0.684902 | 3 | 0 | 3 |
| B3GAT2 | PRKAB1 | 0.679916 | 3 | 0 | 3 |
| B3GAT2 | KCNG2 | 0.675771 | 3 | 0 | 3 |
| B3GAT2 | TBC1D25 | 0.672437 | 3 | 0 | 3 |
| B3GAT2 | GAS8 | 0.671749 | 3 | 0 | 3 |
| B3GAT2 | SLC26A10 | 0.668857 | 3 | 0 | 3 |
| B3GAT2 | FAM8A1 | 0.663918 | 3 | 0 | 3 |
| B3GAT2 | ZNF207 | 0.663847 | 3 | 0 | 3 |
| B3GAT2 | ZCCHC8 | 0.659298 | 3 | 0 | 3 |
| B3GAT2 | TPRKB | 0.657596 | 3 | 0 | 3 |
| B3GAT2 | SPATA2 | 0.651737 | 3 | 0 | 3 |
| B3GAT2 | TNFSF14 | 0.645792 | 3 | 0 | 3 |
For details and further investigation, click here