| Full name: B cell receptor associated protein 29 | Alias Symbol: BAP29|DKFZp686M2086 | ||
| Type: protein-coding gene | Cytoband: 7q22.3 | ||
| Entrez ID: 55973 | HGNC ID: HGNC:24131 | Ensembl Gene: ENSG00000075790 | OMIM ID: |
Screen Evidence:
| |||
Expression of BCAP29:
| Dataset | Gene | EntrezID | Probe | Log2FC | Adj.pValue | Expression |
|---|---|---|---|---|---|---|
| GSE17351 | BCAP29 | 55973 | 225674_at | -0.8274 | 0.0124 | |
| GSE20347 | BCAP29 | 55973 | 205084_at | -1.1520 | 0.0000 | |
| GSE23400 | BCAP29 | 55973 | 205084_at | -0.4037 | 0.0000 | |
| GSE26886 | BCAP29 | 55973 | 225674_at | -0.7064 | 0.0016 | |
| GSE29001 | BCAP29 | 55973 | 205084_at | -0.9994 | 0.0623 | |
| GSE38129 | BCAP29 | 55973 | 205084_at | -0.8030 | 0.0003 | |
| GSE45670 | BCAP29 | 55973 | 225674_at | -0.3875 | 0.0525 | |
| GSE53622 | BCAP29 | 55973 | 155565 | -0.4497 | 0.0000 | |
| GSE53624 | BCAP29 | 55973 | 155565 | -0.5176 | 0.0000 | |
| GSE63941 | BCAP29 | 55973 | 225674_at | -0.9532 | 0.0608 | |
| GSE77861 | BCAP29 | 55973 | 241640_at | -0.3306 | 0.1741 | |
| GSE97050 | BCAP29 | 55973 | A_33_P3287562 | -0.2199 | 0.4162 | |
| SRP007169 | BCAP29 | 55973 | RNAseq | -1.8378 | 0.0000 | |
| SRP008496 | BCAP29 | 55973 | RNAseq | -1.5605 | 0.0000 | |
| SRP064894 | BCAP29 | 55973 | RNAseq | -0.4931 | 0.0082 | |
| SRP133303 | BCAP29 | 55973 | RNAseq | 0.0272 | 0.8481 | |
| SRP159526 | BCAP29 | 55973 | RNAseq | -0.8985 | 0.0028 | |
| SRP193095 | BCAP29 | 55973 | RNAseq | -0.6611 | 0.0004 | |
| SRP219564 | BCAP29 | 55973 | RNAseq | -0.8064 | 0.0109 | |
| TCGA | BCAP29 | 55973 | RNAseq | -0.0103 | 0.8612 |
Upregulated datasets: 0; Downregulated datasets: 3.
Survival by BCAP29 expression:
 | 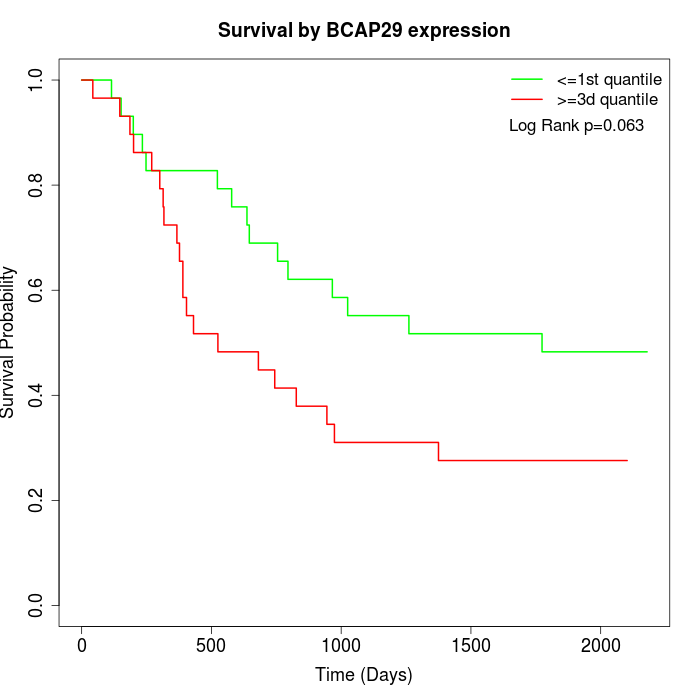 | 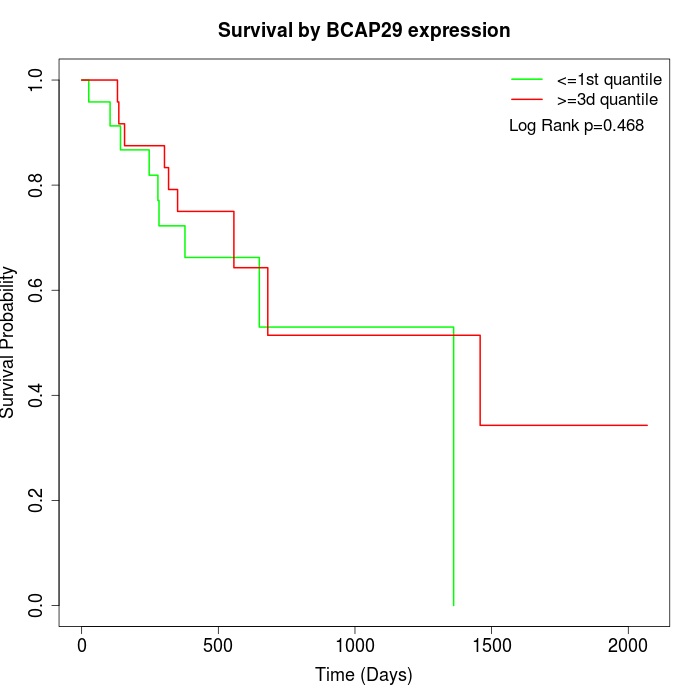 |
| GSE53622 | GSE53624 | TCGA |
Note: Click image to view full size file.
Copy number change of BCAP29:
| Dataset | Gene | EntrezID | Gain | Loss | Normal | Detail |
|---|---|---|---|---|---|---|
| GSE15526 | BCAP29 | 55973 | 12 | 0 | 18 | |
| GSE20123 | BCAP29 | 55973 | 12 | 0 | 18 | |
| GSE43470 | BCAP29 | 55973 | 6 | 2 | 35 | |
| GSE46452 | BCAP29 | 55973 | 10 | 1 | 48 | |
| GSE47630 | BCAP29 | 55973 | 8 | 3 | 29 | |
| GSE54993 | BCAP29 | 55973 | 2 | 9 | 59 | |
| GSE54994 | BCAP29 | 55973 | 16 | 3 | 34 | |
| GSE60625 | BCAP29 | 55973 | 0 | 0 | 11 | |
| GSE74703 | BCAP29 | 55973 | 6 | 2 | 28 | |
| GSE74704 | BCAP29 | 55973 | 8 | 0 | 12 | |
| TCGA | BCAP29 | 55973 | 50 | 10 | 36 |
Total number of gains: 130; Total number of losses: 30; Total Number of normals: 328.
Somatic mutations of BCAP29:
Generating mutation plots.
Highly correlated genes for BCAP29:
Showing top 20/1021 corelated genes with mean PCC>0.5.
| Gene1 | Gene2 | Mean PCC | Num. Datasets | Num. PCC<0 | Num. PCC>0.5 |
|---|---|---|---|---|---|
| BCAP29 | APC | 0.772653 | 5 | 0 | 5 |
| BCAP29 | ELL3 | 0.726348 | 4 | 0 | 3 |
| BCAP29 | SSNA1 | 0.72026 | 3 | 0 | 3 |
| BCAP29 | SNAP29 | 0.717833 | 5 | 0 | 4 |
| BCAP29 | NDN | 0.716044 | 3 | 0 | 3 |
| BCAP29 | LRFN5 | 0.708976 | 3 | 0 | 3 |
| BCAP29 | PLEKHA5 | 0.705566 | 4 | 0 | 4 |
| BCAP29 | SLC25A27 | 0.703867 | 3 | 0 | 3 |
| BCAP29 | ARHGAP44 | 0.68692 | 3 | 0 | 3 |
| BCAP29 | LRRC3B | 0.67787 | 3 | 0 | 3 |
| BCAP29 | TBC1D20 | 0.67772 | 4 | 0 | 4 |
| BCAP29 | BIVM | 0.674885 | 3 | 0 | 3 |
| BCAP29 | HDHD2 | 0.672252 | 5 | 0 | 4 |
| BCAP29 | FAM122A | 0.671533 | 4 | 0 | 3 |
| BCAP29 | ESYT2 | 0.669423 | 5 | 0 | 4 |
| BCAP29 | MSRB3 | 0.667708 | 4 | 0 | 4 |
| BCAP29 | ZNF681 | 0.666388 | 4 | 0 | 4 |
| BCAP29 | ARMCX2 | 0.660709 | 3 | 0 | 3 |
| BCAP29 | C9orf47 | 0.660319 | 3 | 0 | 3 |
| BCAP29 | UGP2 | 0.658636 | 9 | 0 | 7 |
For details and further investigation, click here