| Full name: BCL10 immune signaling adaptor | Alias Symbol: CARMEN|CIPER|mE10|c-E10|CLAP | ||
| Type: protein-coding gene | Cytoband: 1p22.3 | ||
| Entrez ID: 8915 | HGNC ID: HGNC:989 | Ensembl Gene: ENSG00000142867 | OMIM ID: 603517 |
Screen Evidence:
| |||
BCL10 involved pathways:
| KEGG pathway | Description | View |
|---|---|---|
| hsa04660 | T cell receptor signaling pathway | |
| hsa04662 | B cell receptor signaling pathway | |
| hsa05152 | Tuberculosis |
Expression of BCL10:
| Dataset | Gene | EntrezID | Probe | Log2FC | Adj.pValue | Expression |
|---|---|---|---|---|---|---|
| GSE17351 | BCL10 | 8915 | 205263_at | -0.2363 | 0.8005 | |
| GSE20347 | BCL10 | 8915 | 205263_at | -0.7441 | 0.0000 | |
| GSE23400 | BCL10 | 8915 | 205263_at | -0.4742 | 0.0000 | |
| GSE26886 | BCL10 | 8915 | 205263_at | -1.2975 | 0.0000 | |
| GSE29001 | BCL10 | 8915 | 205263_at | -0.8617 | 0.0002 | |
| GSE38129 | BCL10 | 8915 | 205263_at | -0.3943 | 0.0261 | |
| GSE45670 | BCL10 | 8915 | 205263_at | 0.0065 | 0.9781 | |
| GSE53622 | BCL10 | 8915 | 35455 | -0.9238 | 0.0000 | |
| GSE53624 | BCL10 | 8915 | 35455 | -0.8119 | 0.0000 | |
| GSE63941 | BCL10 | 8915 | 205263_at | 0.4383 | 0.2507 | |
| GSE77861 | BCL10 | 8915 | 205263_at | -0.8014 | 0.0007 | |
| GSE97050 | BCL10 | 8915 | A_33_P3392447 | -0.2303 | 0.4438 | |
| SRP007169 | BCL10 | 8915 | RNAseq | -1.2442 | 0.0048 | |
| SRP008496 | BCL10 | 8915 | RNAseq | -1.3933 | 0.0000 | |
| SRP064894 | BCL10 | 8915 | RNAseq | -0.8121 | 0.0000 | |
| SRP133303 | BCL10 | 8915 | RNAseq | -0.1203 | 0.5693 | |
| SRP159526 | BCL10 | 8915 | RNAseq | -1.3508 | 0.0000 | |
| SRP193095 | BCL10 | 8915 | RNAseq | -0.6444 | 0.0000 | |
| SRP219564 | BCL10 | 8915 | RNAseq | -0.6624 | 0.2873 | |
| TCGA | BCL10 | 8915 | RNAseq | 0.0083 | 0.8921 |
Upregulated datasets: 0; Downregulated datasets: 4.
Survival by BCL10 expression:
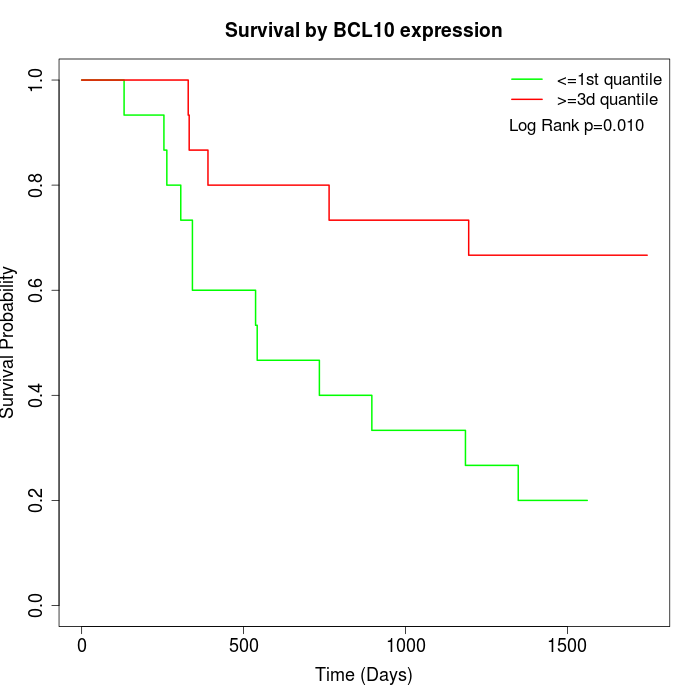 | 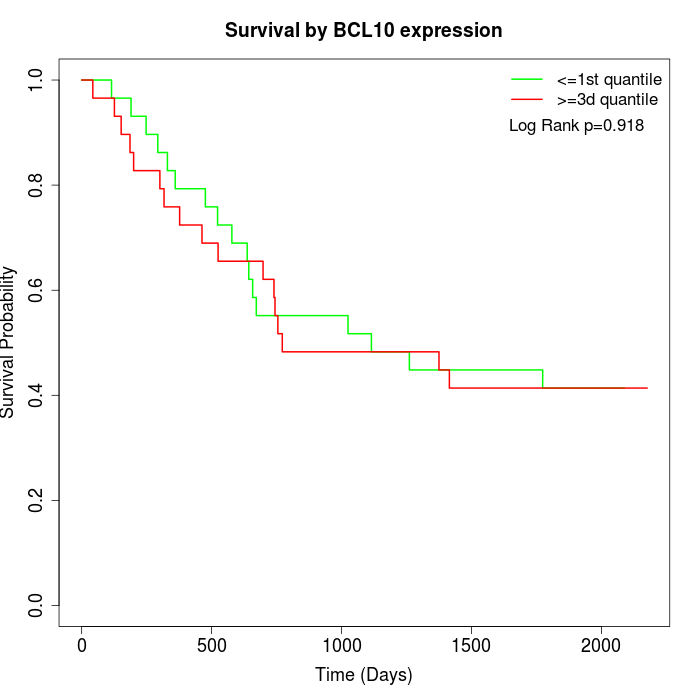 | 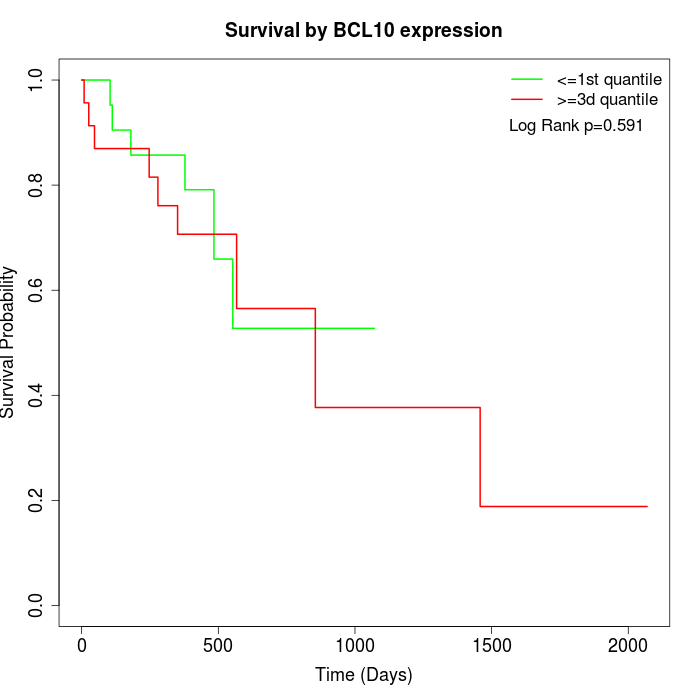 |
| GSE53622 | GSE53624 | TCGA |
Note: Click image to view full size file.
Copy number change of BCL10:
| Dataset | Gene | EntrezID | Gain | Loss | Normal | Detail |
|---|---|---|---|---|---|---|
| GSE15526 | BCL10 | 8915 | 0 | 8 | 22 | |
| GSE20123 | BCL10 | 8915 | 0 | 8 | 22 | |
| GSE43470 | BCL10 | 8915 | 2 | 2 | 39 | |
| GSE46452 | BCL10 | 8915 | 0 | 1 | 58 | |
| GSE47630 | BCL10 | 8915 | 8 | 5 | 27 | |
| GSE54993 | BCL10 | 8915 | 0 | 0 | 70 | |
| GSE54994 | BCL10 | 8915 | 6 | 3 | 44 | |
| GSE60625 | BCL10 | 8915 | 0 | 0 | 11 | |
| GSE74703 | BCL10 | 8915 | 1 | 2 | 33 | |
| GSE74704 | BCL10 | 8915 | 0 | 5 | 15 | |
| TCGA | BCL10 | 8915 | 7 | 23 | 66 |
Total number of gains: 24; Total number of losses: 57; Total Number of normals: 407.
Somatic mutations of BCL10:
Generating mutation plots.
Highly correlated genes for BCL10:
Showing top 20/1325 corelated genes with mean PCC>0.5.
| Gene1 | Gene2 | Mean PCC | Num. Datasets | Num. PCC<0 | Num. PCC>0.5 |
|---|---|---|---|---|---|
| BCL10 | NUAK2 | 0.757411 | 3 | 0 | 3 |
| BCL10 | ABI1 | 0.75242 | 8 | 0 | 8 |
| BCL10 | ZNF416 | 0.751112 | 3 | 0 | 3 |
| BCL10 | MAP2K3 | 0.746169 | 3 | 0 | 3 |
| BCL10 | FBXL16 | 0.740233 | 6 | 0 | 6 |
| BCL10 | KCNK6 | 0.740201 | 5 | 0 | 4 |
| BCL10 | PGM2 | 0.735958 | 6 | 0 | 6 |
| BCL10 | ESYT2 | 0.731397 | 4 | 0 | 4 |
| BCL10 | SFTA2 | 0.725105 | 3 | 0 | 3 |
| BCL10 | CTTNBP2NL | 0.724581 | 7 | 0 | 6 |
| BCL10 | TOM1 | 0.720444 | 10 | 0 | 10 |
| BCL10 | SERPINB8 | 0.71918 | 9 | 0 | 8 |
| BCL10 | SORD | 0.718535 | 3 | 0 | 3 |
| BCL10 | ELOVL1 | 0.718007 | 3 | 0 | 3 |
| BCL10 | LDHD | 0.716844 | 5 | 0 | 4 |
| BCL10 | WARS2 | 0.71669 | 3 | 0 | 3 |
| BCL10 | TEKT5 | 0.71659 | 3 | 0 | 3 |
| BCL10 | PRSS2 | 0.716564 | 7 | 0 | 7 |
| BCL10 | GRPEL2 | 0.712646 | 6 | 0 | 5 |
| BCL10 | FCHO2 | 0.7117 | 6 | 0 | 6 |
For details and further investigation, click here