| Full name: centrosomal protein 89 | Alias Symbol: FLJ14640 | ||
| Type: protein-coding gene | Cytoband: 19q13.11 | ||
| Entrez ID: 84902 | HGNC ID: HGNC:25907 | Ensembl Gene: ENSG00000121289 | OMIM ID: 615470 |
Expression of CEP89:
| Dataset | Gene | EntrezID | Probe | Log2FC | Adj.pValue | Expression |
|---|---|---|---|---|---|---|
| GSE17351 | CEP89 | 84902 | 1553732_s_at | 0.4725 | 0.2999 | |
| GSE26886 | CEP89 | 84902 | 1553732_s_at | 0.9604 | 0.0000 | |
| GSE45670 | CEP89 | 84902 | 1553732_s_at | 0.2778 | 0.1332 | |
| GSE53622 | CEP89 | 84902 | 151503 | 0.0338 | 0.7197 | |
| GSE53624 | CEP89 | 84902 | 38234 | 0.4617 | 0.0000 | |
| GSE63941 | CEP89 | 84902 | 1553732_s_at | -0.7935 | 0.0819 | |
| GSE77861 | CEP89 | 84902 | 1563919_a_at | -0.2434 | 0.1375 | |
| GSE97050 | CEP89 | 84902 | A_23_P130856 | 0.2363 | 0.5065 | |
| SRP007169 | CEP89 | 84902 | RNAseq | 0.8203 | 0.1123 | |
| SRP008496 | CEP89 | 84902 | RNAseq | 0.6534 | 0.0858 | |
| SRP064894 | CEP89 | 84902 | RNAseq | 0.6520 | 0.0001 | |
| SRP133303 | CEP89 | 84902 | RNAseq | 0.2950 | 0.2433 | |
| SRP159526 | CEP89 | 84902 | RNAseq | 0.6318 | 0.0299 | |
| SRP193095 | CEP89 | 84902 | RNAseq | 0.1887 | 0.0658 | |
| SRP219564 | CEP89 | 84902 | RNAseq | 0.1351 | 0.6463 |
Upregulated datasets: 0; Downregulated datasets: 0.
Survival by CEP89 expression:
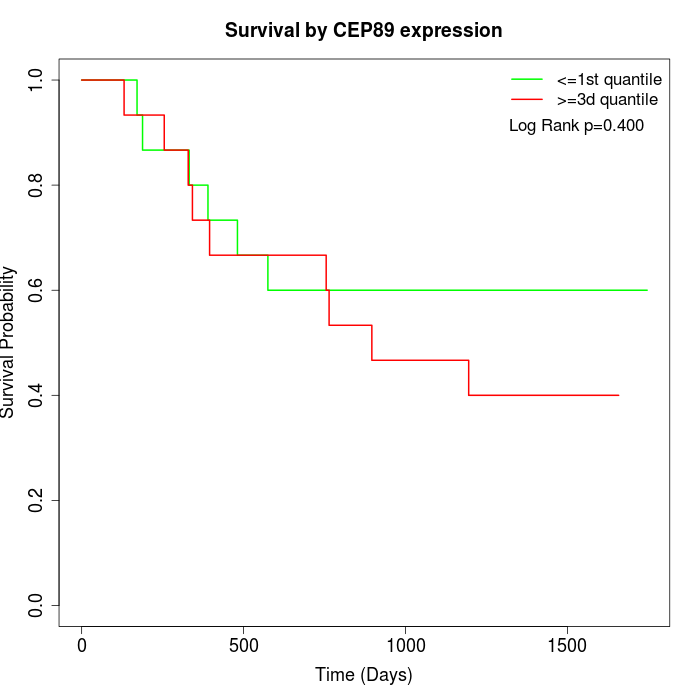 | 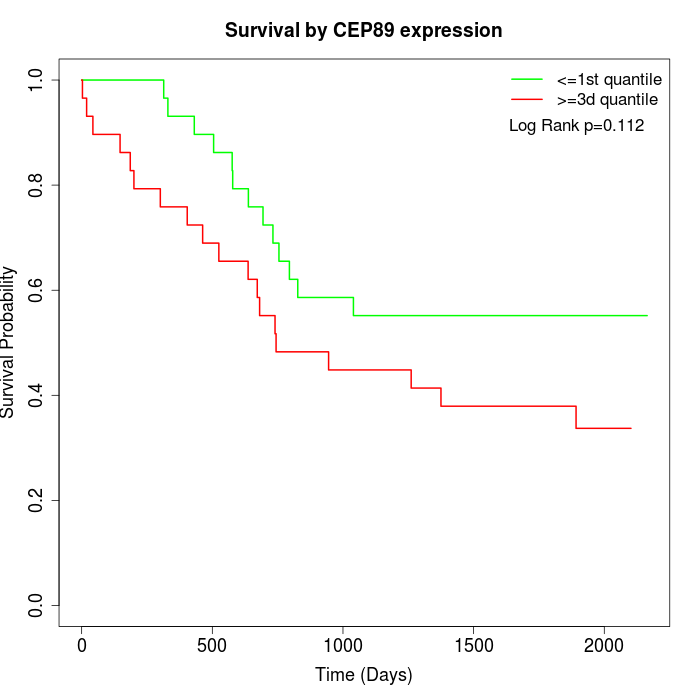 |
| GSE53622 | GSE53624 |
Note: Click image to view full size file.
Copy number change of CEP89:
| Dataset | Gene | EntrezID | Gain | Loss | Normal | Detail |
|---|---|---|---|---|---|---|
| GSE15526 | CEP89 | 84902 | 7 | 6 | 17 | |
| GSE20123 | CEP89 | 84902 | 7 | 5 | 18 | |
| GSE43470 | CEP89 | 84902 | 4 | 6 | 33 | |
| GSE46452 | CEP89 | 84902 | 47 | 1 | 11 | |
| GSE47630 | CEP89 | 84902 | 8 | 6 | 26 | |
| GSE54993 | CEP89 | 84902 | 17 | 3 | 50 | |
| GSE54994 | CEP89 | 84902 | 7 | 9 | 37 | |
| GSE60625 | CEP89 | 84902 | 9 | 0 | 2 | |
| GSE74703 | CEP89 | 84902 | 4 | 4 | 28 | |
| GSE74704 | CEP89 | 84902 | 6 | 3 | 11 | |
| TCGA | CEP89 | 84902 | 18 | 12 | 66 |
Total number of gains: 134; Total number of losses: 55; Total Number of normals: 299.
Somatic mutations of CEP89:
Generating mutation plots.
Highly correlated genes for CEP89:
Showing top 20/237 corelated genes with mean PCC>0.5.
| Gene1 | Gene2 | Mean PCC | Num. Datasets | Num. PCC<0 | Num. PCC>0.5 |
|---|---|---|---|---|---|
| CEP89 | INPP5B | 0.773168 | 3 | 0 | 3 |
| CEP89 | SNRPF | 0.767657 | 3 | 0 | 3 |
| CEP89 | CRCP | 0.720024 | 3 | 0 | 3 |
| CEP89 | PSMG4 | 0.704543 | 3 | 0 | 3 |
| CEP89 | BUD31 | 0.695348 | 3 | 0 | 3 |
| CEP89 | TSEN34 | 0.692613 | 3 | 0 | 3 |
| CEP89 | LAMA4 | 0.689413 | 3 | 0 | 3 |
| CEP89 | PFDN4 | 0.689264 | 3 | 0 | 3 |
| CEP89 | NOC2L | 0.689243 | 3 | 0 | 3 |
| CEP89 | HEATR6 | 0.687812 | 3 | 0 | 3 |
| CEP89 | USE1 | 0.686181 | 4 | 0 | 3 |
| CEP89 | SMARCC1 | 0.685815 | 3 | 0 | 3 |
| CEP89 | HABP4 | 0.683345 | 3 | 0 | 3 |
| CEP89 | PCID2 | 0.680023 | 3 | 0 | 3 |
| CEP89 | TM2D1 | 0.67766 | 3 | 0 | 3 |
| CEP89 | LYRM4 | 0.6775 | 4 | 0 | 4 |
| CEP89 | CCR10 | 0.67728 | 3 | 0 | 3 |
| CEP89 | IQCK | 0.675799 | 3 | 0 | 3 |
| CEP89 | ANAPC10 | 0.675396 | 3 | 0 | 3 |
| CEP89 | A1BG | 0.67083 | 4 | 0 | 4 |
For details and further investigation, click here