| Full name: cytoplasmic linker associated protein 1 | Alias Symbol: KIAA0622|MAST1 | ||
| Type: protein-coding gene | Cytoband: 2q14.2-q14.3 | ||
| Entrez ID: 23332 | HGNC ID: HGNC:17088 | Ensembl Gene: ENSG00000074054 | OMIM ID: 605852 |
Expression of CLASP1:
| Dataset | Gene | EntrezID | Probe | Log2FC | Adj.pValue | Expression |
|---|---|---|---|---|---|---|
| GSE17351 | CLASP1 | 23332 | 212752_at | 0.1243 | 0.7414 | |
| GSE20347 | CLASP1 | 23332 | 212752_at | 0.1879 | 0.1389 | |
| GSE23400 | CLASP1 | 23332 | 212752_at | 0.2646 | 0.0220 | |
| GSE26886 | CLASP1 | 23332 | 212752_at | 0.2056 | 0.2769 | |
| GSE29001 | CLASP1 | 23332 | 212752_at | 0.1816 | 0.6204 | |
| GSE38129 | CLASP1 | 23332 | 212752_at | 0.1993 | 0.2350 | |
| GSE45670 | CLASP1 | 23332 | 212752_at | 0.0357 | 0.8241 | |
| GSE53622 | CLASP1 | 23332 | 53243 | 0.1301 | 0.0726 | |
| GSE53624 | CLASP1 | 23332 | 50468 | 0.2444 | 0.0000 | |
| GSE63941 | CLASP1 | 23332 | 212752_at | -0.4451 | 0.2710 | |
| GSE77861 | CLASP1 | 23332 | 212752_at | 0.8286 | 0.0340 | |
| GSE97050 | CLASP1 | 23332 | A_23_P311232 | -0.0560 | 0.8603 | |
| SRP007169 | CLASP1 | 23332 | RNAseq | 1.2621 | 0.0218 | |
| SRP008496 | CLASP1 | 23332 | RNAseq | 0.9834 | 0.0065 | |
| SRP064894 | CLASP1 | 23332 | RNAseq | -0.0785 | 0.7398 | |
| SRP133303 | CLASP1 | 23332 | RNAseq | 0.3858 | 0.0160 | |
| SRP159526 | CLASP1 | 23332 | RNAseq | 0.3948 | 0.0871 | |
| SRP193095 | CLASP1 | 23332 | RNAseq | 0.2898 | 0.0073 | |
| SRP219564 | CLASP1 | 23332 | RNAseq | -0.0054 | 0.9857 | |
| TCGA | CLASP1 | 23332 | RNAseq | 0.0780 | 0.1650 |
Upregulated datasets: 1; Downregulated datasets: 0.
Survival by CLASP1 expression:
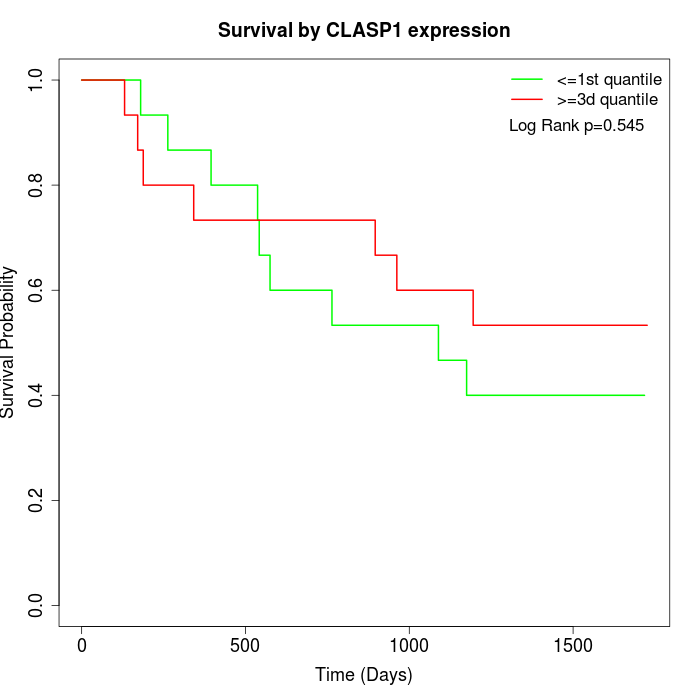 | 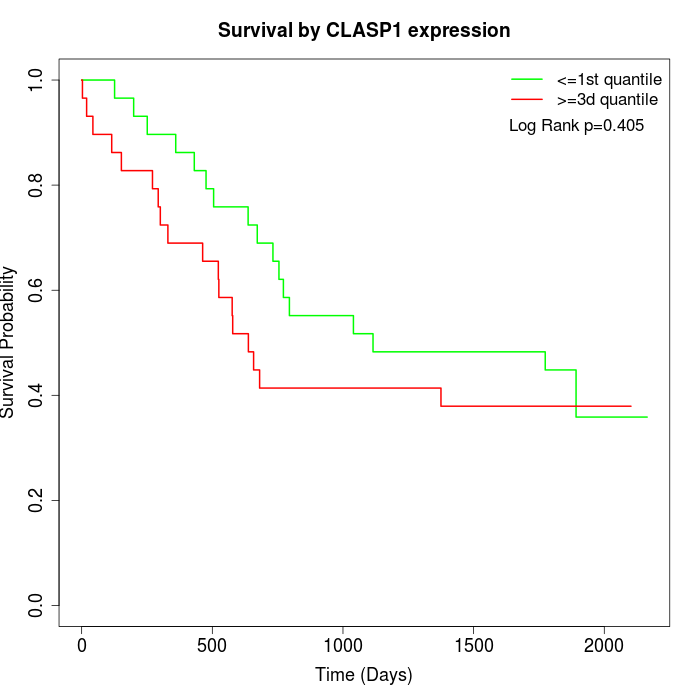 | 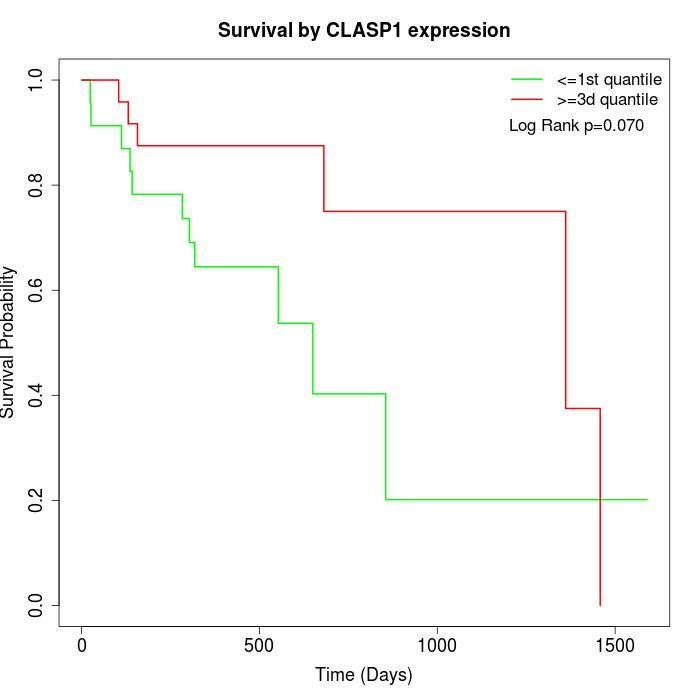 |
| GSE53622 | GSE53624 | TCGA |
Note: Click image to view full size file.
Copy number change of CLASP1:
| Dataset | Gene | EntrezID | Gain | Loss | Normal | Detail |
|---|---|---|---|---|---|---|
| GSE15526 | CLASP1 | 23332 | 6 | 2 | 22 | |
| GSE20123 | CLASP1 | 23332 | 6 | 2 | 22 | |
| GSE43470 | CLASP1 | 23332 | 3 | 1 | 39 | |
| GSE46452 | CLASP1 | 23332 | 1 | 3 | 55 | |
| GSE47630 | CLASP1 | 23332 | 6 | 0 | 34 | |
| GSE54993 | CLASP1 | 23332 | 0 | 6 | 64 | |
| GSE54994 | CLASP1 | 23332 | 12 | 0 | 41 | |
| GSE60625 | CLASP1 | 23332 | 0 | 3 | 8 | |
| GSE74703 | CLASP1 | 23332 | 3 | 1 | 32 | |
| GSE74704 | CLASP1 | 23332 | 3 | 1 | 16 | |
| TCGA | CLASP1 | 23332 | 32 | 6 | 58 |
Total number of gains: 72; Total number of losses: 25; Total Number of normals: 391.
Somatic mutations of CLASP1:
Generating mutation plots.
Highly correlated genes for CLASP1:
Showing top 20/557 corelated genes with mean PCC>0.5.
| Gene1 | Gene2 | Mean PCC | Num. Datasets | Num. PCC<0 | Num. PCC>0.5 |
|---|---|---|---|---|---|
| CLASP1 | RAB11FIP5 | 0.814334 | 3 | 0 | 3 |
| CLASP1 | PTGFRN | 0.803847 | 3 | 0 | 3 |
| CLASP1 | LDLR | 0.801059 | 3 | 0 | 3 |
| CLASP1 | PRDM5 | 0.7835 | 3 | 0 | 3 |
| CLASP1 | MOAP1 | 0.777317 | 3 | 0 | 3 |
| CLASP1 | RFTN1 | 0.768315 | 3 | 0 | 3 |
| CLASP1 | ZNF423 | 0.767383 | 3 | 0 | 3 |
| CLASP1 | KHNYN | 0.758958 | 4 | 0 | 4 |
| CLASP1 | SCARB2 | 0.755008 | 3 | 0 | 3 |
| CLASP1 | CDKN1C | 0.749081 | 3 | 0 | 3 |
| CLASP1 | OTUD7B | 0.736236 | 3 | 0 | 3 |
| CLASP1 | CERCAM | 0.7348 | 3 | 0 | 3 |
| CLASP1 | GLYR1 | 0.73018 | 3 | 0 | 3 |
| CLASP1 | BICD2 | 0.728379 | 3 | 0 | 3 |
| CLASP1 | CD93 | 0.727774 | 3 | 0 | 3 |
| CLASP1 | SPIRE1 | 0.720212 | 4 | 0 | 4 |
| CLASP1 | GNG11 | 0.719574 | 3 | 0 | 3 |
| CLASP1 | RRAS2 | 0.716322 | 3 | 0 | 3 |
| CLASP1 | DNMBP | 0.713006 | 3 | 0 | 3 |
| CLASP1 | MAP7D1 | 0.712446 | 3 | 0 | 3 |
For details and further investigation, click here