| Full name: chymase 1 | Alias Symbol: | ||
| Type: protein-coding gene | Cytoband: 14q12 | ||
| Entrez ID: 1215 | HGNC ID: HGNC:2097 | Ensembl Gene: ENSG00000092009 | OMIM ID: 118938 |
| Related drugs: CHEMBL374027... [more] | |||
Expression of CMA1:
| Dataset | Gene | EntrezID | Probe | Log2FC | Adj.pValue | Expression |
|---|---|---|---|---|---|---|
| GSE17351 | CMA1 | 1215 | 214533_at | -0.7531 | 0.3219 | |
| GSE20347 | CMA1 | 1215 | 214533_at | -0.1814 | 0.0498 | |
| GSE23400 | CMA1 | 1215 | 214533_at | -0.1662 | 0.0001 | |
| GSE26886 | CMA1 | 1215 | 214533_at | 0.1347 | 0.2411 | |
| GSE29001 | CMA1 | 1215 | 214533_at | 0.0009 | 0.9957 | |
| GSE38129 | CMA1 | 1215 | 214533_at | -0.7241 | 0.0020 | |
| GSE45670 | CMA1 | 1215 | 214533_at | -1.7845 | 0.0000 | |
| GSE53622 | CMA1 | 1215 | 20224 | -2.4834 | 0.0000 | |
| GSE53624 | CMA1 | 1215 | 68390 | -1.8333 | 0.0000 | |
| GSE63941 | CMA1 | 1215 | 214533_at | -0.0539 | 0.8011 | |
| GSE77861 | CMA1 | 1215 | 214533_at | -0.0595 | 0.6587 | |
| GSE97050 | CMA1 | 1215 | A_23_P151778 | -0.3291 | 0.6293 | |
| SRP064894 | CMA1 | 1215 | RNAseq | -1.7502 | 0.0020 | |
| SRP133303 | CMA1 | 1215 | RNAseq | -2.4766 | 0.0000 | |
| SRP159526 | CMA1 | 1215 | RNAseq | -1.3843 | 0.0542 | |
| TCGA | CMA1 | 1215 | RNAseq | -3.2327 | 0.0003 |
Upregulated datasets: 0; Downregulated datasets: 6.
Survival by CMA1 expression:
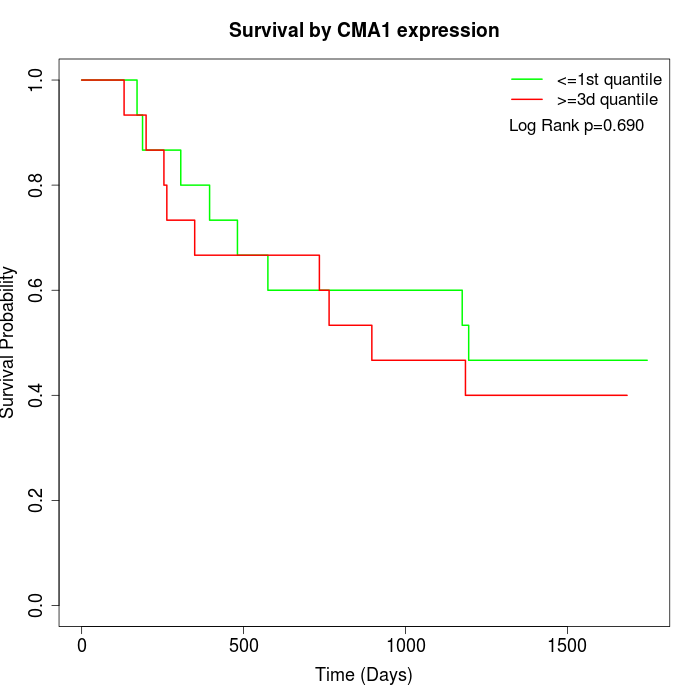 | 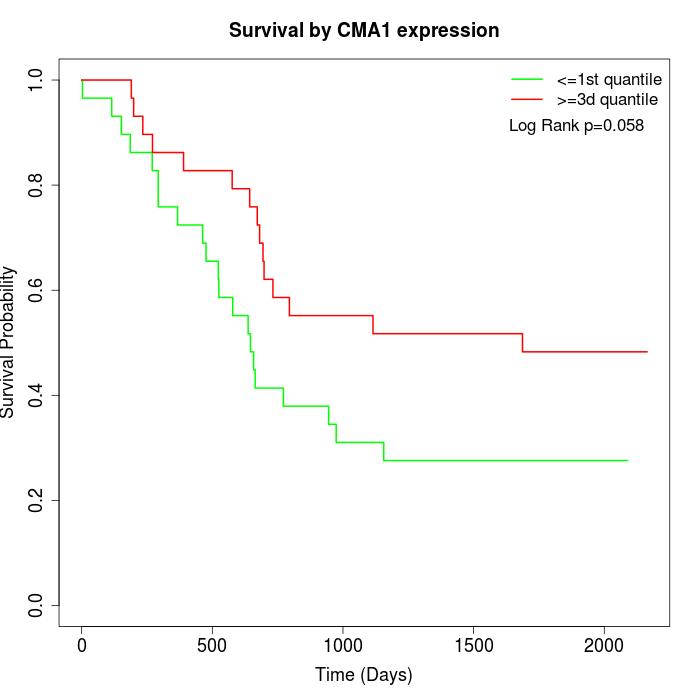 | 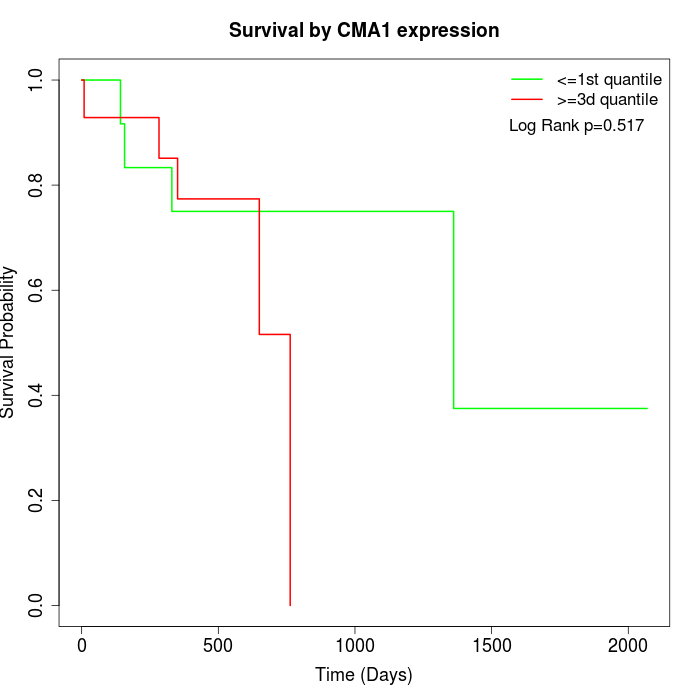 |
| GSE53622 | GSE53624 | TCGA |
Note: Click image to view full size file.
Copy number change of CMA1:
| Dataset | Gene | EntrezID | Gain | Loss | Normal | Detail |
|---|---|---|---|---|---|---|
| GSE15526 | CMA1 | 1215 | 8 | 3 | 19 | |
| GSE20123 | CMA1 | 1215 | 8 | 3 | 19 | |
| GSE43470 | CMA1 | 1215 | 8 | 2 | 33 | |
| GSE46452 | CMA1 | 1215 | 16 | 2 | 41 | |
| GSE47630 | CMA1 | 1215 | 11 | 10 | 19 | |
| GSE54993 | CMA1 | 1215 | 3 | 11 | 56 | |
| GSE54994 | CMA1 | 1215 | 18 | 5 | 30 | |
| GSE60625 | CMA1 | 1215 | 0 | 2 | 9 | |
| GSE74703 | CMA1 | 1215 | 7 | 2 | 27 | |
| GSE74704 | CMA1 | 1215 | 3 | 2 | 15 | |
| TCGA | CMA1 | 1215 | 28 | 12 | 56 |
Total number of gains: 110; Total number of losses: 54; Total Number of normals: 324.
Somatic mutations of CMA1:
Generating mutation plots.
Highly correlated genes for CMA1:
Showing top 20/937 corelated genes with mean PCC>0.5.
| Gene1 | Gene2 | Mean PCC | Num. Datasets | Num. PCC<0 | Num. PCC>0.5 |
|---|---|---|---|---|---|
| CMA1 | CCL14 | 0.826397 | 3 | 0 | 3 |
| CMA1 | PLCXD3 | 0.798031 | 4 | 0 | 4 |
| CMA1 | ANGPTL1 | 0.790763 | 5 | 0 | 5 |
| CMA1 | MEOX2 | 0.771779 | 8 | 0 | 8 |
| CMA1 | CYP21A2 | 0.765339 | 3 | 0 | 3 |
| CMA1 | MAS1L | 0.750421 | 4 | 0 | 4 |
| CMA1 | GIMAP5 | 0.746301 | 3 | 0 | 3 |
| CMA1 | FBXL3 | 0.734153 | 3 | 0 | 3 |
| CMA1 | FIBIN | 0.730015 | 3 | 0 | 3 |
| CMA1 | CLEC14A | 0.727887 | 5 | 0 | 5 |
| CMA1 | CCDC82 | 0.720283 | 3 | 0 | 3 |
| CMA1 | SRPX | 0.719021 | 4 | 0 | 4 |
| CMA1 | MAMDC2 | 0.717839 | 5 | 0 | 5 |
| CMA1 | KCNT2 | 0.71252 | 5 | 0 | 5 |
| CMA1 | TMEM255A | 0.712093 | 3 | 0 | 3 |
| CMA1 | PID1 | 0.709426 | 7 | 0 | 6 |
| CMA1 | ABCA8 | 0.7075 | 8 | 0 | 7 |
| CMA1 | TMEM100 | 0.706988 | 7 | 0 | 6 |
| CMA1 | CILP | 0.706521 | 9 | 0 | 7 |
| CMA1 | COL14A1 | 0.70514 | 8 | 0 | 6 |
For details and further investigation, click here