| Full name: cortistatin | Alias Symbol: MGC32686 | ||
| Type: protein-coding gene | Cytoband: 1p36.22 | ||
| Entrez ID: 1325 | HGNC ID: HGNC:2257 | Ensembl Gene: ENSG00000241563 | OMIM ID: 602784 |
| Related drugs: GLUCAGON... [more] | |||
Expression of CORT:
| Dataset | Gene | EntrezID | Probe | Log2FC | Adj.pValue | Expression |
|---|---|---|---|---|---|---|
| GSE17351 | CORT | 1325 | 210182_at | 0.1731 | 0.5492 | |
| GSE20347 | CORT | 1325 | 210182_at | 0.0768 | 0.2361 | |
| GSE23400 | CORT | 1325 | 210182_at | -0.0394 | 0.2426 | |
| GSE26886 | CORT | 1325 | 210182_at | 0.5389 | 0.0003 | |
| GSE29001 | CORT | 1325 | 210182_at | 0.0731 | 0.4578 | |
| GSE38129 | CORT | 1325 | 210182_at | 0.0894 | 0.2311 | |
| GSE45670 | CORT | 1325 | 210182_at | 0.1875 | 0.1087 | |
| GSE63941 | CORT | 1325 | 210182_at | 0.5661 | 0.0102 | |
| GSE77861 | CORT | 1325 | 210182_at | -0.0103 | 0.9319 | |
| GSE97050 | CORT | 1325 | A_23_P258164 | 0.0178 | 0.9376 | |
| SRP159526 | CORT | 1325 | RNAseq | 1.0633 | 0.2013 | |
| SRP219564 | CORT | 1325 | RNAseq | 0.9662 | 0.1003 | |
| TCGA | CORT | 1325 | RNAseq | 0.5743 | 0.0468 |
Upregulated datasets: 0; Downregulated datasets: 0.
Survival by CORT expression:
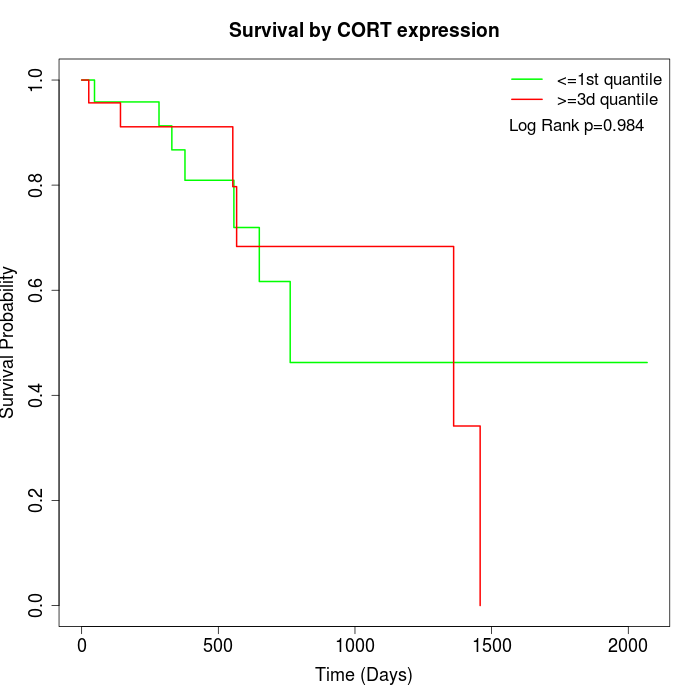 |
| TCGA |
Note: Click image to view full size file.
Copy number change of CORT:
| Dataset | Gene | EntrezID | Gain | Loss | Normal | Detail |
|---|---|---|---|---|---|---|
| GSE15526 | CORT | 1325 | 0 | 5 | 25 | |
| GSE20123 | CORT | 1325 | 0 | 3 | 27 | |
| GSE43470 | CORT | 1325 | 7 | 5 | 31 | |
| GSE46452 | CORT | 1325 | 7 | 1 | 51 | |
| GSE47630 | CORT | 1325 | 8 | 4 | 28 | |
| GSE54993 | CORT | 1325 | 3 | 1 | 66 | |
| GSE54994 | CORT | 1325 | 11 | 4 | 38 | |
| GSE60625 | CORT | 1325 | 0 | 0 | 11 | |
| GSE74703 | CORT | 1325 | 6 | 3 | 27 | |
| GSE74704 | CORT | 1325 | 0 | 0 | 20 | |
| TCGA | CORT | 1325 | 10 | 24 | 62 |
Total number of gains: 52; Total number of losses: 50; Total Number of normals: 386.
Somatic mutations of CORT:
Generating mutation plots.
Highly correlated genes for CORT:
Showing top 20/303 corelated genes with mean PCC>0.5.
| Gene1 | Gene2 | Mean PCC | Num. Datasets | Num. PCC<0 | Num. PCC>0.5 |
|---|---|---|---|---|---|
| CORT | CHMP1A | 0.764498 | 3 | 0 | 3 |
| CORT | DPM3 | 0.759672 | 3 | 0 | 3 |
| CORT | GPR150 | 0.751318 | 3 | 0 | 3 |
| CORT | BPIFB4 | 0.745017 | 3 | 0 | 3 |
| CORT | CLDN14 | 0.72336 | 4 | 0 | 3 |
| CORT | ATXN7L2 | 0.714399 | 3 | 0 | 3 |
| CORT | ABCA4 | 0.712256 | 3 | 0 | 3 |
| CORT | VAV2 | 0.707865 | 3 | 0 | 3 |
| CORT | ITIH3 | 0.707458 | 3 | 0 | 3 |
| CORT | POLE4 | 0.70482 | 3 | 0 | 3 |
| CORT | TFE3 | 0.701548 | 3 | 0 | 3 |
| CORT | PEF1 | 0.700798 | 4 | 0 | 4 |
| CORT | APBA2 | 0.700122 | 3 | 0 | 3 |
| CORT | SLC8A3 | 0.698972 | 3 | 0 | 3 |
| CORT | VWA5B2 | 0.698081 | 4 | 0 | 4 |
| CORT | TUT1 | 0.696235 | 4 | 0 | 4 |
| CORT | APTX | 0.695519 | 3 | 0 | 3 |
| CORT | ATP2B3 | 0.695313 | 3 | 0 | 3 |
| CORT | OTOF | 0.693678 | 3 | 0 | 3 |
| CORT | CCL26 | 0.691982 | 3 | 0 | 3 |
For details and further investigation, click here