| Full name: ceruloplasmin | Alias Symbol: | ||
| Type: protein-coding gene | Cytoband: 3q24-q25.1 | ||
| Entrez ID: 1356 | HGNC ID: HGNC:2295 | Ensembl Gene: ENSG00000047457 | OMIM ID: 117700 |
| Related drugs: AMPICILLIN, ANAKINRA, BUTHIONINE SULFOXIMINE, CLOMIPHENE CITRATE, DANAZOL, DEXRAZOXANE, DIETHYLSTILBESTROL, ESTRADIOL, HYDROXYUREA, INTERFERON BETA... [more] | |||
Expression of CP:
| Dataset | Gene | EntrezID | Probe | Log2FC | Adj.pValue | Expression |
|---|---|---|---|---|---|---|
| GSE17351 | CP | 1356 | 227253_at | -0.5396 | 0.6456 | |
| GSE20347 | CP | 1356 | 204846_at | 0.2122 | 0.1424 | |
| GSE23400 | CP | 1356 | 204846_at | 0.0699 | 0.5199 | |
| GSE26886 | CP | 1356 | 228143_at | 0.8117 | 0.2472 | |
| GSE29001 | CP | 1356 | 204846_at | 0.3524 | 0.3186 | |
| GSE38129 | CP | 1356 | 204846_at | -0.1248 | 0.4756 | |
| GSE45670 | CP | 1356 | 228143_at | -1.8294 | 0.0007 | |
| GSE63941 | CP | 1356 | 227253_at | 1.6423 | 0.3590 | |
| GSE77861 | CP | 1356 | 1558034_s_at | 0.2876 | 0.3779 | |
| GSE97050 | CP | 1356 | A_33_P3296587 | 0.3483 | 0.4642 | |
| SRP064894 | CP | 1356 | RNAseq | 0.2866 | 0.6383 | |
| SRP133303 | CP | 1356 | RNAseq | -0.3480 | 0.6015 | |
| SRP159526 | CP | 1356 | RNAseq | 0.4814 | 0.5195 | |
| SRP193095 | CP | 1356 | RNAseq | 2.2706 | 0.0000 | |
| SRP219564 | CP | 1356 | RNAseq | 2.0267 | 0.0385 | |
| TCGA | CP | 1356 | RNAseq | -0.3736 | 0.4320 |
Upregulated datasets: 2; Downregulated datasets: 1.
Survival by CP expression:
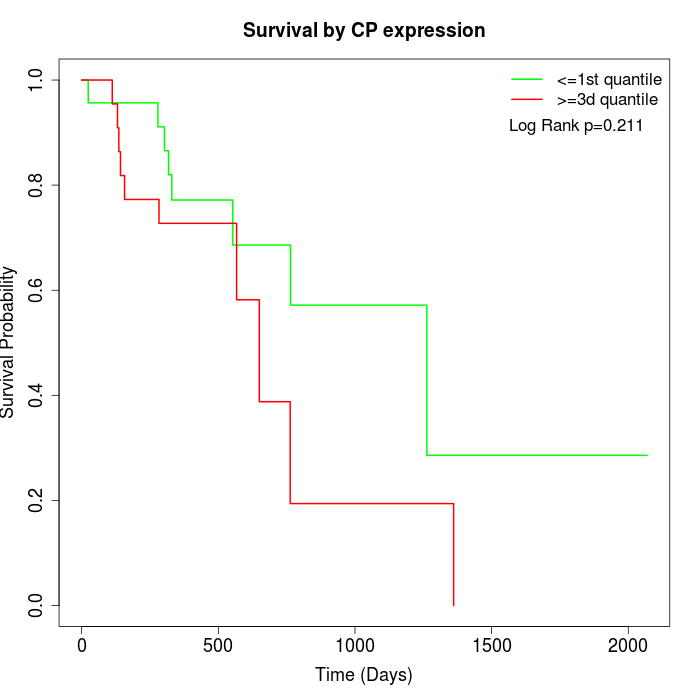 |
| TCGA |
Note: Click image to view full size file.
Copy number change of CP:
| Dataset | Gene | EntrezID | Gain | Loss | Normal | Detail |
|---|---|---|---|---|---|---|
| GSE15526 | CP | 1356 | 22 | 0 | 8 | |
| GSE20123 | CP | 1356 | 22 | 0 | 8 | |
| GSE43470 | CP | 1356 | 23 | 0 | 20 | |
| GSE46452 | CP | 1356 | 18 | 2 | 39 | |
| GSE47630 | CP | 1356 | 19 | 3 | 18 | |
| GSE54993 | CP | 1356 | 1 | 10 | 59 | |
| GSE54994 | CP | 1356 | 37 | 1 | 15 | |
| GSE60625 | CP | 1356 | 0 | 6 | 5 | |
| GSE74703 | CP | 1356 | 20 | 0 | 16 | |
| GSE74704 | CP | 1356 | 15 | 0 | 5 | |
| TCGA | CP | 1356 | 71 | 1 | 24 |
Total number of gains: 248; Total number of losses: 23; Total Number of normals: 217.
Somatic mutations of CP:
Generating mutation plots.
Highly correlated genes for CP:
Showing top 20/106 corelated genes with mean PCC>0.5.
| Gene1 | Gene2 | Mean PCC | Num. Datasets | Num. PCC<0 | Num. PCC>0.5 |
|---|---|---|---|---|---|
| CP | EYA1 | 0.771375 | 3 | 0 | 3 |
| CP | TOX3 | 0.706948 | 3 | 0 | 3 |
| CP | FDCSP | 0.690724 | 3 | 0 | 3 |
| CP | DDO | 0.684987 | 3 | 0 | 3 |
| CP | ENPP5 | 0.684187 | 4 | 0 | 3 |
| CP | CCR4 | 0.674491 | 3 | 0 | 3 |
| CP | BPIFB1 | 0.670201 | 6 | 0 | 6 |
| CP | NPY1R | 0.67006 | 5 | 0 | 4 |
| CP | DMBT1 | 0.664018 | 4 | 0 | 4 |
| CP | PLA2G2A | 0.648502 | 3 | 0 | 3 |
| CP | HPGDS | 0.647302 | 3 | 0 | 3 |
| CP | EPDR1 | 0.6419 | 4 | 0 | 4 |
| CP | PROM1 | 0.641688 | 6 | 0 | 5 |
| CP | RAB37 | 0.637442 | 4 | 0 | 3 |
| CP | MIA | 0.629537 | 4 | 0 | 4 |
| CP | RGS13 | 0.628729 | 4 | 0 | 4 |
| CP | TFF3 | 0.626704 | 4 | 0 | 4 |
| CP | PIGR | 0.626475 | 3 | 0 | 3 |
| CP | GPIHBP1 | 0.625689 | 3 | 0 | 3 |
| CP | APOD | 0.624759 | 4 | 0 | 3 |
For details and further investigation, click here