| Full name: ependymin related 1 | Alias Symbol: MERP-1|MERP1|UCC1|EPDR | ||
| Type: protein-coding gene | Cytoband: 7p14.1 | ||
| Entrez ID: 54749 | HGNC ID: HGNC:17572 | Ensembl Gene: ENSG00000086289 | OMIM ID: |
Expression of EPDR1:
| Dataset | Gene | EntrezID | Probe | Log2FC | Adj.pValue | Expression |
|---|---|---|---|---|---|---|
| GSE17351 | EPDR1 | 54749 | 223253_at | -0.5360 | 0.7346 | |
| GSE26886 | EPDR1 | 54749 | 223253_at | 1.3784 | 0.0057 | |
| GSE45670 | EPDR1 | 54749 | 223253_at | -2.0213 | 0.0001 | |
| GSE53622 | EPDR1 | 54749 | 109073 | 0.5081 | 0.0052 | |
| GSE53624 | EPDR1 | 54749 | 109073 | 0.5375 | 0.0015 | |
| GSE63941 | EPDR1 | 54749 | 223253_at | -3.3711 | 0.1580 | |
| GSE77861 | EPDR1 | 54749 | 223253_at | 0.1845 | 0.3545 | |
| GSE97050 | EPDR1 | 54749 | A_24_P166613 | -0.2177 | 0.4779 | |
| SRP007169 | EPDR1 | 54749 | RNAseq | 5.2460 | 0.0000 | |
| SRP008496 | EPDR1 | 54749 | RNAseq | 4.0527 | 0.0000 | |
| SRP064894 | EPDR1 | 54749 | RNAseq | 0.4759 | 0.1683 | |
| SRP133303 | EPDR1 | 54749 | RNAseq | 0.6072 | 0.0762 | |
| SRP159526 | EPDR1 | 54749 | RNAseq | 0.6942 | 0.0488 | |
| SRP219564 | EPDR1 | 54749 | RNAseq | -0.4019 | 0.6229 | |
| TCGA | EPDR1 | 54749 | RNAseq | -0.0707 | 0.7047 |
Upregulated datasets: 3; Downregulated datasets: 1.
Survival by EPDR1 expression:
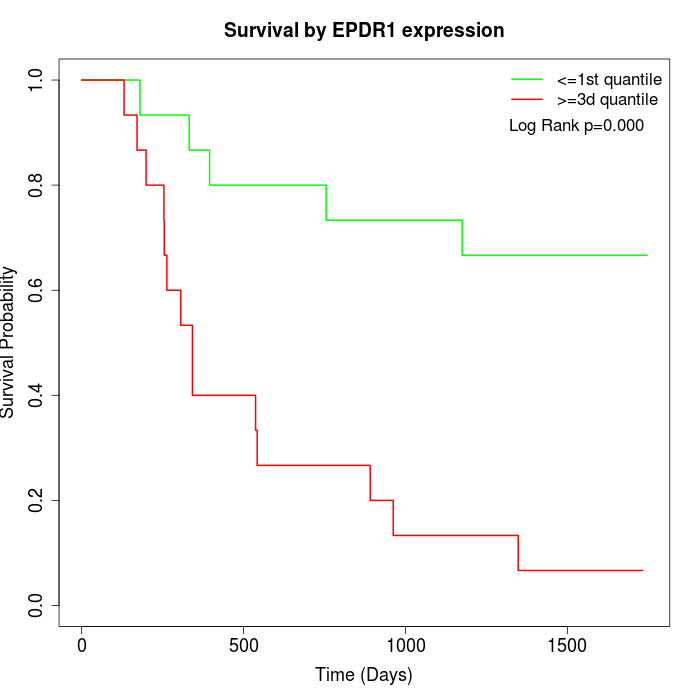 |  |  |
| GSE53622 | GSE53624 | TCGA |
Note: Click image to view full size file.
Copy number change of EPDR1:
| Dataset | Gene | EntrezID | Gain | Loss | Normal | Detail |
|---|---|---|---|---|---|---|
| GSE15526 | EPDR1 | 54749 | 15 | 0 | 15 | |
| GSE20123 | EPDR1 | 54749 | 14 | 0 | 16 | |
| GSE43470 | EPDR1 | 54749 | 4 | 0 | 39 | |
| GSE46452 | EPDR1 | 54749 | 11 | 1 | 47 | |
| GSE47630 | EPDR1 | 54749 | 8 | 1 | 31 | |
| GSE54993 | EPDR1 | 54749 | 0 | 7 | 63 | |
| GSE54994 | EPDR1 | 54749 | 18 | 3 | 32 | |
| GSE60625 | EPDR1 | 54749 | 0 | 0 | 11 | |
| GSE74703 | EPDR1 | 54749 | 4 | 0 | 32 | |
| GSE74704 | EPDR1 | 54749 | 8 | 0 | 12 | |
| TCGA | EPDR1 | 54749 | 51 | 8 | 37 |
Total number of gains: 133; Total number of losses: 20; Total Number of normals: 335.
Somatic mutations of EPDR1:
Generating mutation plots.
Highly correlated genes for EPDR1:
Showing top 20/856 corelated genes with mean PCC>0.5.
| Gene1 | Gene2 | Mean PCC | Num. Datasets | Num. PCC<0 | Num. PCC>0.5 |
|---|---|---|---|---|---|
| EPDR1 | CELF2 | 0.806408 | 3 | 0 | 3 |
| EPDR1 | ZNF423 | 0.805669 | 5 | 0 | 5 |
| EPDR1 | DMD | 0.788012 | 3 | 0 | 3 |
| EPDR1 | KLF11 | 0.782794 | 3 | 0 | 3 |
| EPDR1 | RNASE4 | 0.78038 | 3 | 0 | 3 |
| EPDR1 | ECSCR | 0.767662 | 4 | 0 | 4 |
| EPDR1 | RBPJ | 0.763817 | 3 | 0 | 3 |
| EPDR1 | FIBIN | 0.758407 | 4 | 0 | 3 |
| EPDR1 | MYCT1 | 0.757487 | 4 | 0 | 3 |
| EPDR1 | CA11 | 0.756243 | 3 | 0 | 3 |
| EPDR1 | BHLHE22 | 0.753296 | 4 | 0 | 4 |
| EPDR1 | DTNA | 0.747931 | 3 | 0 | 3 |
| EPDR1 | CPE | 0.74512 | 4 | 0 | 4 |
| EPDR1 | PLCB4 | 0.743251 | 4 | 0 | 4 |
| EPDR1 | DZIP1 | 0.742019 | 4 | 0 | 4 |
| EPDR1 | CASQ2 | 0.741465 | 3 | 0 | 3 |
| EPDR1 | DLC1 | 0.739009 | 5 | 0 | 4 |
| EPDR1 | CYGB | 0.737835 | 3 | 0 | 3 |
| EPDR1 | SMTNL2 | 0.73449 | 3 | 0 | 3 |
| EPDR1 | FXYD6 | 0.731675 | 6 | 0 | 6 |
For details and further investigation, click here