| Full name: quinolinate phosphoribosyltransferase | Alias Symbol: QPRTase | ||
| Type: protein-coding gene | Cytoband: 16p11.2 | ||
| Entrez ID: 23475 | HGNC ID: HGNC:9755 | Ensembl Gene: ENSG00000103485 | OMIM ID: 606248 |
| Related drugs: NIACIN... [more] | |||
Expression of QPRT:
| Dataset | Gene | EntrezID | Probe | Log2FC | Adj.pValue | Expression |
|---|---|---|---|---|---|---|
| GSE20347 | QPRT | 23475 | 204044_at | 0.4421 | 0.0250 | |
| GSE23400 | QPRT | 23475 | 204044_at | 0.0380 | 0.5934 | |
| GSE29001 | QPRT | 23475 | 204044_at | 0.1697 | 0.4609 | |
| GSE38129 | QPRT | 23475 | 204044_at | 0.4013 | 0.0514 | |
| GSE53622 | QPRT | 23475 | 24350 | 0.3415 | 0.0309 | |
| GSE53624 | QPRT | 23475 | 24350 | 0.5242 | 0.0023 | |
| GSE97050 | QPRT | 23475 | A_23_P34233 | 0.0984 | 0.6013 | |
| SRP007169 | QPRT | 23475 | RNAseq | 0.3481 | 0.5761 | |
| SRP064894 | QPRT | 23475 | RNAseq | -0.0762 | 0.8051 | |
| SRP133303 | QPRT | 23475 | RNAseq | -0.3378 | 0.0737 | |
| SRP159526 | QPRT | 23475 | RNAseq | 0.0077 | 0.9875 | |
| SRP193095 | QPRT | 23475 | RNAseq | 0.3141 | 0.1136 | |
| SRP219564 | QPRT | 23475 | RNAseq | -0.0044 | 0.9921 | |
| TCGA | QPRT | 23475 | RNAseq | -0.3222 | 0.1892 |
Upregulated datasets: 0; Downregulated datasets: 0.
Survival by QPRT expression:
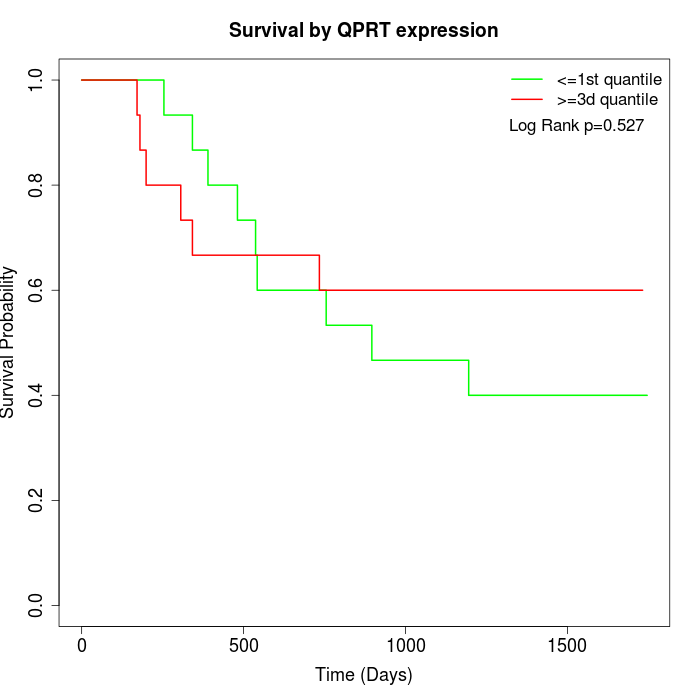 | 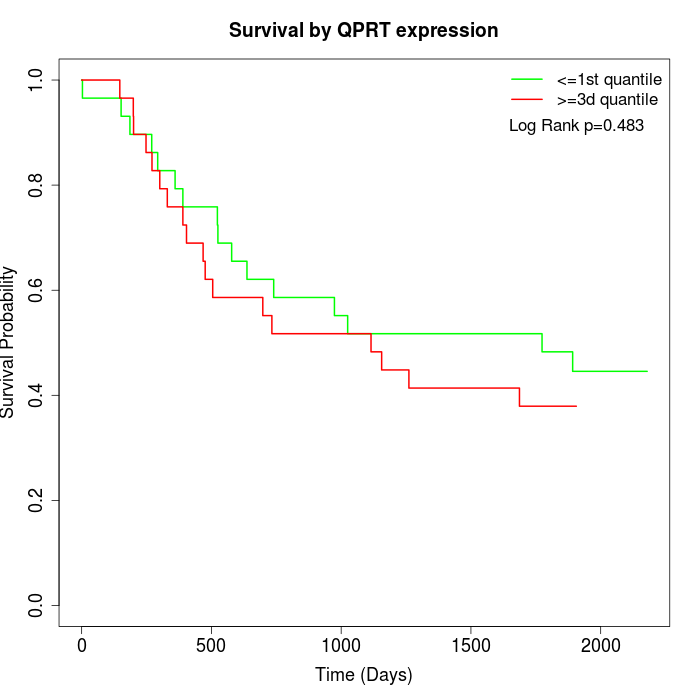 | 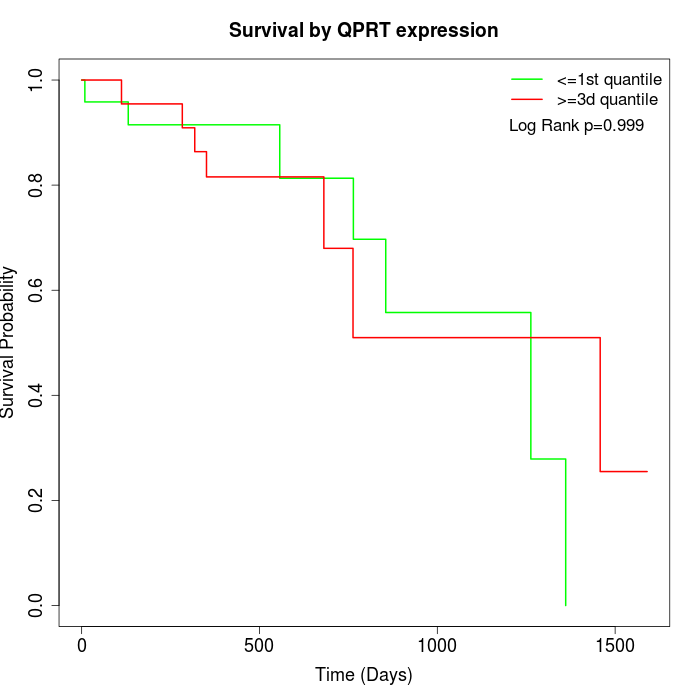 |
| GSE53622 | GSE53624 | TCGA |
Note: Click image to view full size file.
Copy number change of QPRT:
| Dataset | Gene | EntrezID | Gain | Loss | Normal | Detail |
|---|---|---|---|---|---|---|
| GSE15526 | QPRT | 23475 | 5 | 5 | 20 | |
| GSE20123 | QPRT | 23475 | 5 | 4 | 21 | |
| GSE43470 | QPRT | 23475 | 3 | 3 | 37 | |
| GSE46452 | QPRT | 23475 | 38 | 1 | 20 | |
| GSE47630 | QPRT | 23475 | 11 | 7 | 22 | |
| GSE54993 | QPRT | 23475 | 3 | 5 | 62 | |
| GSE54994 | QPRT | 23475 | 5 | 9 | 39 | |
| GSE60625 | QPRT | 23475 | 4 | 0 | 7 | |
| GSE74703 | QPRT | 23475 | 3 | 2 | 31 | |
| GSE74704 | QPRT | 23475 | 3 | 2 | 15 | |
| TCGA | QPRT | 23475 | 20 | 11 | 65 |
Total number of gains: 100; Total number of losses: 49; Total Number of normals: 339.
Somatic mutations of QPRT:
Generating mutation plots.
Highly correlated genes for QPRT:
Showing top 20/56 corelated genes with mean PCC>0.5.
| Gene1 | Gene2 | Mean PCC | Num. Datasets | Num. PCC<0 | Num. PCC>0.5 |
|---|---|---|---|---|---|
| QPRT | SV2B | 0.761944 | 3 | 0 | 3 |
| QPRT | CRABP1 | 0.756221 | 4 | 0 | 4 |
| QPRT | GABRB1 | 0.729433 | 3 | 0 | 3 |
| QPRT | CDH12 | 0.694029 | 3 | 0 | 3 |
| QPRT | CHI3L2 | 0.693708 | 3 | 0 | 3 |
| QPRT | BEX1 | 0.680281 | 4 | 0 | 3 |
| QPRT | TP53BP1 | 0.679117 | 4 | 0 | 4 |
| QPRT | MFSD10 | 0.678377 | 3 | 0 | 3 |
| QPRT | CLSTN3 | 0.672435 | 3 | 0 | 3 |
| QPRT | NUBP2 | 0.671187 | 3 | 0 | 3 |
| QPRT | DIO3 | 0.670462 | 3 | 0 | 3 |
| QPRT | GNAZ | 0.666378 | 3 | 0 | 3 |
| QPRT | CCDC28B | 0.639318 | 7 | 0 | 6 |
| QPRT | CHGB | 0.638796 | 3 | 0 | 3 |
| QPRT | NTHL1 | 0.637025 | 4 | 0 | 3 |
| QPRT | SEZ6L2 | 0.632069 | 5 | 0 | 4 |
| QPRT | ACVR2B | 0.627744 | 3 | 0 | 3 |
| QPRT | QPCT | 0.622823 | 4 | 0 | 3 |
| QPRT | AGPAT1 | 0.622798 | 4 | 0 | 3 |
| QPRT | DUSP9 | 0.621272 | 4 | 0 | 3 |
For details and further investigation, click here