| Full name: CST telomere replication complex component 1 | Alias Symbol: FLJ22170|AAF132 | ||
| Type: protein-coding gene | Cytoband: 17p13.1 | ||
| Entrez ID: 80169 | HGNC ID: HGNC:26169 | Ensembl Gene: ENSG00000178971 | OMIM ID: 613129 |
Screen Evidence:
| |||
Expression of CTC1:
| Dataset | Gene | EntrezID | Probe | Log2FC | Adj.pValue | Expression |
|---|---|---|---|---|---|---|
| GSE17351 | CTC1 | 80169 | 219435_at | 0.1804 | 0.7625 | |
| GSE20347 | CTC1 | 80169 | 219435_at | 0.2003 | 0.0353 | |
| GSE23400 | CTC1 | 80169 | 219435_at | -0.0962 | 0.0473 | |
| GSE26886 | CTC1 | 80169 | 219435_at | 0.2117 | 0.2618 | |
| GSE29001 | CTC1 | 80169 | 219435_at | 0.1303 | 0.6118 | |
| GSE38129 | CTC1 | 80169 | 219435_at | 0.0549 | 0.5674 | |
| GSE45670 | CTC1 | 80169 | 219435_at | 0.1377 | 0.3602 | |
| GSE53622 | CTC1 | 80169 | 226 | -0.7351 | 0.0000 | |
| GSE53624 | CTC1 | 80169 | 226 | -1.1950 | 0.0000 | |
| GSE63941 | CTC1 | 80169 | 219435_at | 0.2489 | 0.5431 | |
| GSE77861 | CTC1 | 80169 | 240875_at | -0.0127 | 0.9391 | |
| GSE97050 | CTC1 | 80169 | A_33_P3312104 | -0.7671 | 0.0844 | |
| SRP007169 | CTC1 | 80169 | RNAseq | -1.0875 | 0.0512 | |
| SRP008496 | CTC1 | 80169 | RNAseq | -0.9899 | 0.0099 | |
| SRP064894 | CTC1 | 80169 | RNAseq | -0.2116 | 0.1501 | |
| SRP133303 | CTC1 | 80169 | RNAseq | -0.4825 | 0.0000 | |
| SRP159526 | CTC1 | 80169 | RNAseq | -0.2454 | 0.4722 | |
| SRP193095 | CTC1 | 80169 | RNAseq | -0.1508 | 0.2199 | |
| SRP219564 | CTC1 | 80169 | RNAseq | -0.1065 | 0.7189 |
Upregulated datasets: 0; Downregulated datasets: 1.
Survival by CTC1 expression:
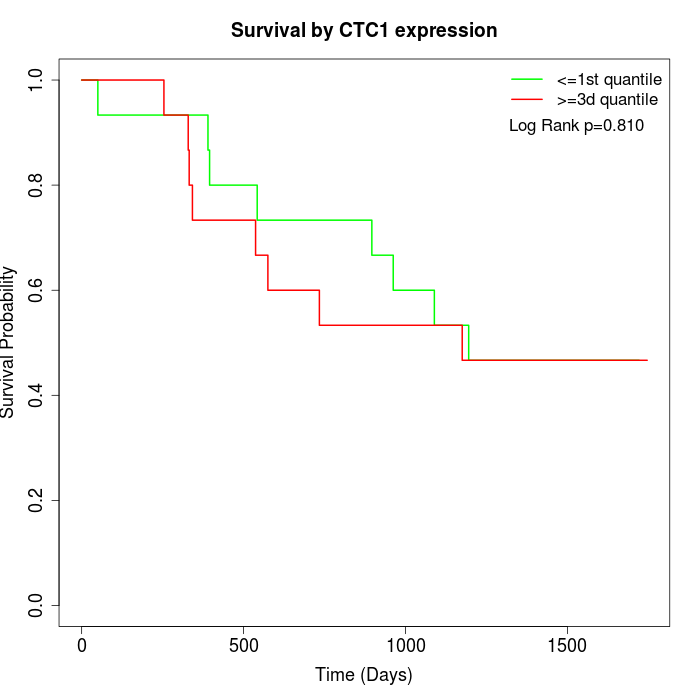 | 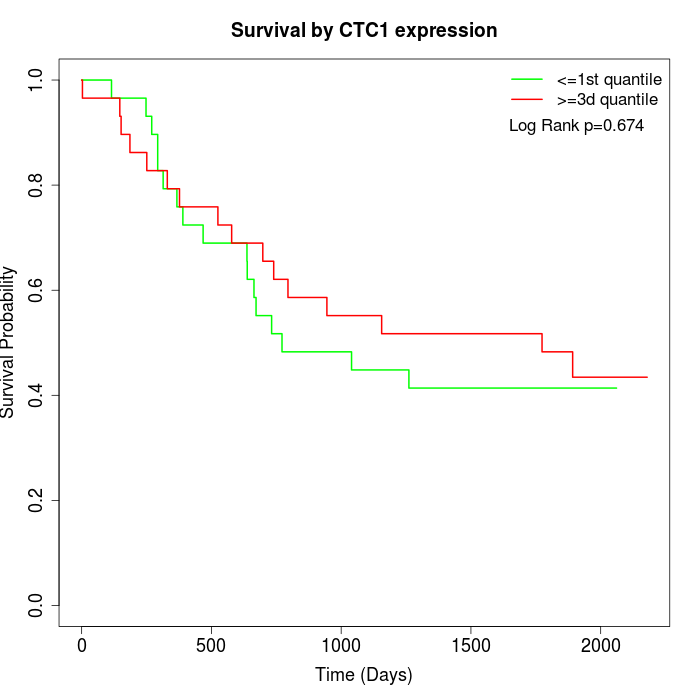 |
| GSE53622 | GSE53624 |
Note: Click image to view full size file.
Copy number change of CTC1:
| Dataset | Gene | EntrezID | Gain | Loss | Normal | Detail |
|---|---|---|---|---|---|---|
| GSE15526 | CTC1 | 80169 | 4 | 2 | 24 | |
| GSE20123 | CTC1 | 80169 | 4 | 3 | 23 | |
| GSE43470 | CTC1 | 80169 | 1 | 6 | 36 | |
| GSE46452 | CTC1 | 80169 | 34 | 1 | 24 | |
| GSE47630 | CTC1 | 80169 | 7 | 1 | 32 | |
| GSE54993 | CTC1 | 80169 | 4 | 3 | 63 | |
| GSE54994 | CTC1 | 80169 | 5 | 8 | 40 | |
| GSE60625 | CTC1 | 80169 | 4 | 0 | 7 | |
| GSE74703 | CTC1 | 80169 | 1 | 3 | 32 | |
| GSE74704 | CTC1 | 80169 | 2 | 1 | 17 | |
| TCGA | CTC1 | 80169 | 17 | 21 | 58 |
Total number of gains: 83; Total number of losses: 49; Total Number of normals: 356.
Somatic mutations of CTC1:
Generating mutation plots.
Highly correlated genes for CTC1:
Showing top 20/156 corelated genes with mean PCC>0.5.
| Gene1 | Gene2 | Mean PCC | Num. Datasets | Num. PCC<0 | Num. PCC>0.5 |
|---|---|---|---|---|---|
| CTC1 | SLMAP | 0.716102 | 3 | 0 | 3 |
| CTC1 | NFIA | 0.716093 | 3 | 0 | 3 |
| CTC1 | KANK2 | 0.707555 | 3 | 0 | 3 |
| CTC1 | LDB3 | 0.701066 | 4 | 0 | 4 |
| CTC1 | EIF4E3 | 0.693245 | 3 | 0 | 3 |
| CTC1 | FBXO9 | 0.679931 | 3 | 0 | 3 |
| CTC1 | VMAC | 0.678255 | 3 | 0 | 3 |
| CTC1 | C3orf18 | 0.677792 | 3 | 0 | 3 |
| CTC1 | LMOD1 | 0.677339 | 3 | 0 | 3 |
| CTC1 | C7 | 0.669162 | 4 | 0 | 4 |
| CTC1 | HIC2 | 0.668207 | 4 | 0 | 3 |
| CTC1 | DES | 0.666014 | 3 | 0 | 3 |
| CTC1 | AK3 | 0.664711 | 3 | 0 | 3 |
| CTC1 | XKR4 | 0.663254 | 3 | 0 | 3 |
| CTC1 | MYOCD | 0.66316 | 3 | 0 | 3 |
| CTC1 | EIF4EBP2 | 0.662741 | 3 | 0 | 3 |
| CTC1 | NUDT3 | 0.658812 | 3 | 0 | 3 |
| CTC1 | CGNL1 | 0.658122 | 3 | 0 | 3 |
| CTC1 | CELA2B | 0.657719 | 3 | 0 | 3 |
| CTC1 | CCDC69 | 0.657636 | 3 | 0 | 3 |
For details and further investigation, click here