| Full name: CTD nuclear envelope phosphatase 1 | Alias Symbol: HSA011916|NET56 | ||
| Type: protein-coding gene | Cytoband: 17p13.1 | ||
| Entrez ID: 23399 | HGNC ID: HGNC:19085 | Ensembl Gene: ENSG00000175826 | OMIM ID: 610684 |
Expression of CTDNEP1:
| Dataset | Gene | EntrezID | Probe | Log2FC | Adj.pValue | Expression |
|---|---|---|---|---|---|---|
| GSE17351 | CTDNEP1 | 23399 | 200035_at | 0.2649 | 0.2942 | |
| GSE20347 | CTDNEP1 | 23399 | 200035_at | 0.0596 | 0.5819 | |
| GSE23400 | CTDNEP1 | 23399 | 200035_at | 0.1875 | 0.0023 | |
| GSE26886 | CTDNEP1 | 23399 | 200035_at | 0.2683 | 0.0666 | |
| GSE29001 | CTDNEP1 | 23399 | 200035_at | 0.0824 | 0.6571 | |
| GSE38129 | CTDNEP1 | 23399 | 200035_at | 0.1187 | 0.1345 | |
| GSE45670 | CTDNEP1 | 23399 | 200035_at | 0.1830 | 0.0779 | |
| GSE53622 | CTDNEP1 | 23399 | 51627 | 0.2442 | 0.0000 | |
| GSE53624 | CTDNEP1 | 23399 | 51627 | 0.2679 | 0.0000 | |
| GSE63941 | CTDNEP1 | 23399 | 200035_at | 0.2214 | 0.2647 | |
| GSE77861 | CTDNEP1 | 23399 | 200035_at | 0.2503 | 0.3259 | |
| GSE97050 | CTDNEP1 | 23399 | A_24_P142473 | 0.6533 | 0.1127 | |
| SRP007169 | CTDNEP1 | 23399 | RNAseq | -0.3828 | 0.2237 | |
| SRP008496 | CTDNEP1 | 23399 | RNAseq | -0.4427 | 0.0156 | |
| SRP064894 | CTDNEP1 | 23399 | RNAseq | 0.4495 | 0.0218 | |
| SRP133303 | CTDNEP1 | 23399 | RNAseq | 0.0271 | 0.8300 | |
| SRP159526 | CTDNEP1 | 23399 | RNAseq | 0.2612 | 0.1319 | |
| SRP193095 | CTDNEP1 | 23399 | RNAseq | 0.0561 | 0.5125 | |
| SRP219564 | CTDNEP1 | 23399 | RNAseq | 0.6117 | 0.0719 |
Upregulated datasets: 0; Downregulated datasets: 0.
Survival by CTDNEP1 expression:
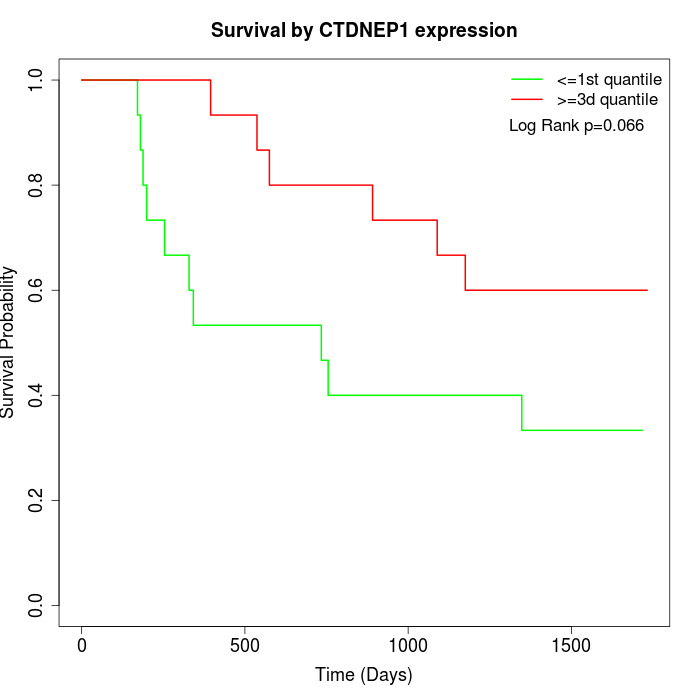 | 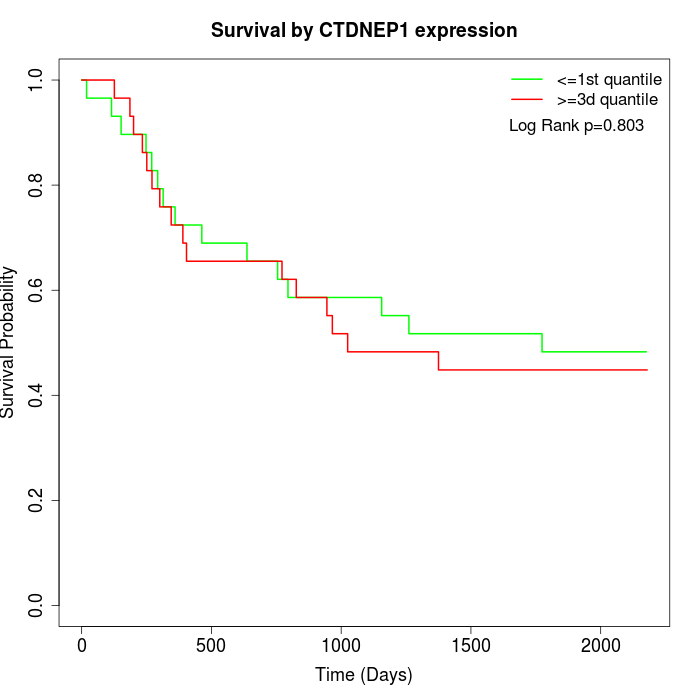 |
| GSE53622 | GSE53624 |
Note: Click image to view full size file.
Copy number change of CTDNEP1:
| Dataset | Gene | EntrezID | Gain | Loss | Normal | Detail |
|---|---|---|---|---|---|---|
| GSE15526 | CTDNEP1 | 23399 | 4 | 2 | 24 | |
| GSE20123 | CTDNEP1 | 23399 | 4 | 3 | 23 | |
| GSE43470 | CTDNEP1 | 23399 | 1 | 4 | 38 | |
| GSE46452 | CTDNEP1 | 23399 | 34 | 1 | 24 | |
| GSE47630 | CTDNEP1 | 23399 | 7 | 1 | 32 | |
| GSE54993 | CTDNEP1 | 23399 | 4 | 3 | 63 | |
| GSE54994 | CTDNEP1 | 23399 | 5 | 8 | 40 | |
| GSE60625 | CTDNEP1 | 23399 | 4 | 0 | 7 | |
| GSE74703 | CTDNEP1 | 23399 | 1 | 2 | 33 | |
| GSE74704 | CTDNEP1 | 23399 | 2 | 1 | 17 | |
| TCGA | CTDNEP1 | 23399 | 17 | 21 | 58 |
Total number of gains: 83; Total number of losses: 46; Total Number of normals: 359.
Somatic mutations of CTDNEP1:
Generating mutation plots.
Highly correlated genes for CTDNEP1:
Showing top 20/351 corelated genes with mean PCC>0.5.
| Gene1 | Gene2 | Mean PCC | Num. Datasets | Num. PCC<0 | Num. PCC>0.5 |
|---|---|---|---|---|---|
| CTDNEP1 | ORAI2 | 0.702775 | 3 | 0 | 3 |
| CTDNEP1 | TNKS1BP1 | 0.679214 | 4 | 0 | 4 |
| CTDNEP1 | PPP1R9B | 0.66911 | 3 | 0 | 3 |
| CTDNEP1 | SIPA1 | 0.637219 | 5 | 0 | 4 |
| CTDNEP1 | ATP2A2 | 0.634638 | 4 | 0 | 3 |
| CTDNEP1 | YIF1B | 0.633772 | 4 | 0 | 3 |
| CTDNEP1 | JAK3 | 0.633642 | 3 | 0 | 3 |
| CTDNEP1 | CORO1B | 0.631817 | 5 | 0 | 3 |
| CTDNEP1 | LPCAT2 | 0.628512 | 3 | 0 | 3 |
| CTDNEP1 | RNF213 | 0.628193 | 3 | 0 | 3 |
| CTDNEP1 | TCIRG1 | 0.622655 | 5 | 0 | 4 |
| CTDNEP1 | JAGN1 | 0.622173 | 3 | 0 | 3 |
| CTDNEP1 | WRAP53 | 0.619452 | 7 | 0 | 7 |
| CTDNEP1 | TKT | 0.616149 | 3 | 0 | 3 |
| CTDNEP1 | KDM1B | 0.615803 | 5 | 0 | 3 |
| CTDNEP1 | CNTROB | 0.613604 | 8 | 0 | 7 |
| CTDNEP1 | MCTP2 | 0.611737 | 3 | 0 | 3 |
| CTDNEP1 | TMEM132A | 0.608406 | 6 | 0 | 5 |
| CTDNEP1 | TLCD1 | 0.604334 | 6 | 0 | 4 |
| CTDNEP1 | FMNL1 | 0.603341 | 4 | 0 | 4 |
For details and further investigation, click here