| Full name: CTD phosphatase subunit 1 | Alias Symbol: FCP1 | ||
| Type: protein-coding gene | Cytoband: 18q23 | ||
| Entrez ID: 9150 | HGNC ID: HGNC:2498 | Ensembl Gene: ENSG00000060069 | OMIM ID: 604927 |
Expression of CTDP1:
| Dataset | Gene | EntrezID | Probe | Log2FC | Adj.pValue | Expression |
|---|---|---|---|---|---|---|
| GSE17351 | CTDP1 | 9150 | 205035_at | 0.0555 | 0.8800 | |
| GSE20347 | CTDP1 | 9150 | 205035_at | -0.1657 | 0.0774 | |
| GSE23400 | CTDP1 | 9150 | 205035_at | -0.1815 | 0.0000 | |
| GSE26886 | CTDP1 | 9150 | 205035_at | 0.0148 | 0.9236 | |
| GSE29001 | CTDP1 | 9150 | 205035_at | -0.1042 | 0.4671 | |
| GSE38129 | CTDP1 | 9150 | 205035_at | -0.0656 | 0.4628 | |
| GSE45670 | CTDP1 | 9150 | 205035_at | 0.0905 | 0.3312 | |
| GSE53622 | CTDP1 | 9150 | 32733 | -0.1860 | 0.0137 | |
| GSE53624 | CTDP1 | 9150 | 32733 | -0.2021 | 0.0051 | |
| GSE63941 | CTDP1 | 9150 | 205035_at | -0.3158 | 0.1752 | |
| GSE77861 | CTDP1 | 9150 | 205035_at | 0.1448 | 0.4751 | |
| GSE97050 | CTDP1 | 9150 | A_23_P101111 | 0.1906 | 0.4962 | |
| SRP007169 | CTDP1 | 9150 | RNAseq | -1.1398 | 0.0412 | |
| SRP064894 | CTDP1 | 9150 | RNAseq | -0.0363 | 0.7976 | |
| SRP133303 | CTDP1 | 9150 | RNAseq | 0.0373 | 0.7801 | |
| SRP159526 | CTDP1 | 9150 | RNAseq | -0.0639 | 0.8289 | |
| SRP193095 | CTDP1 | 9150 | RNAseq | 0.0953 | 0.4027 | |
| SRP219564 | CTDP1 | 9150 | RNAseq | -0.2323 | 0.5038 | |
| TCGA | CTDP1 | 9150 | RNAseq | -0.0338 | 0.5197 |
Upregulated datasets: 0; Downregulated datasets: 1.
Survival by CTDP1 expression:
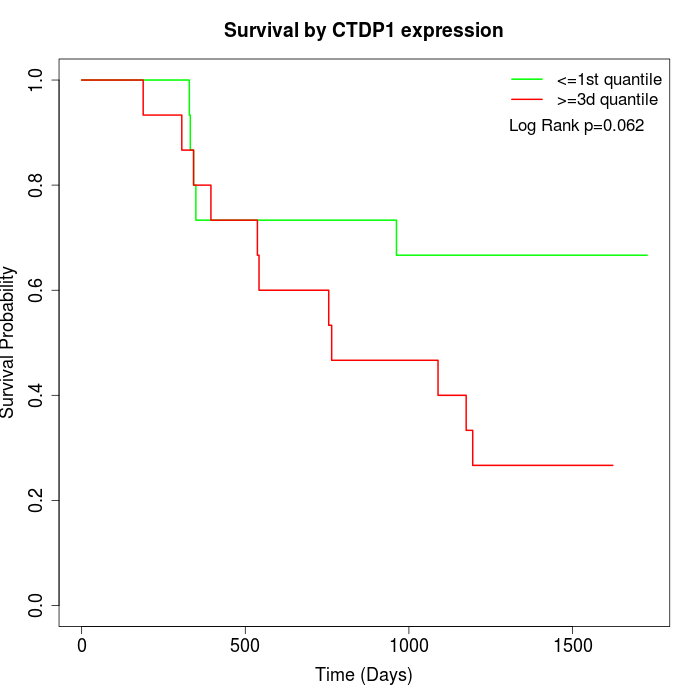 | 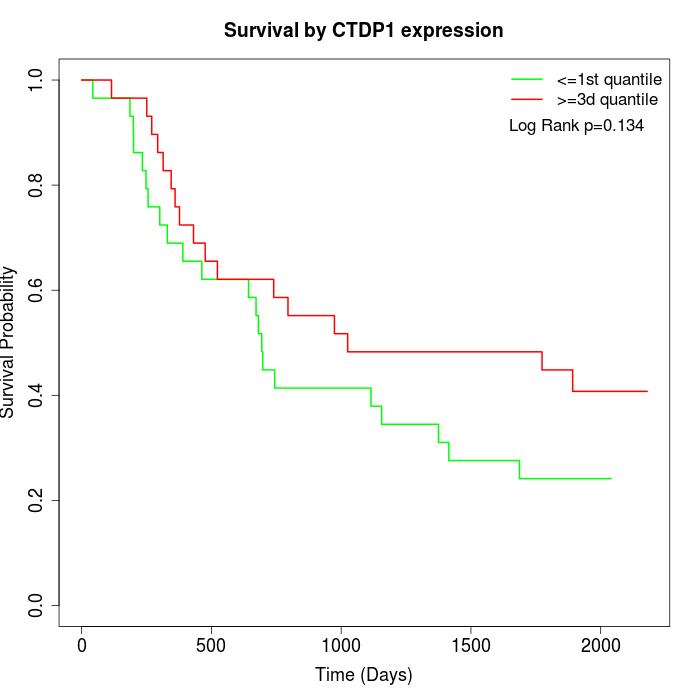 | 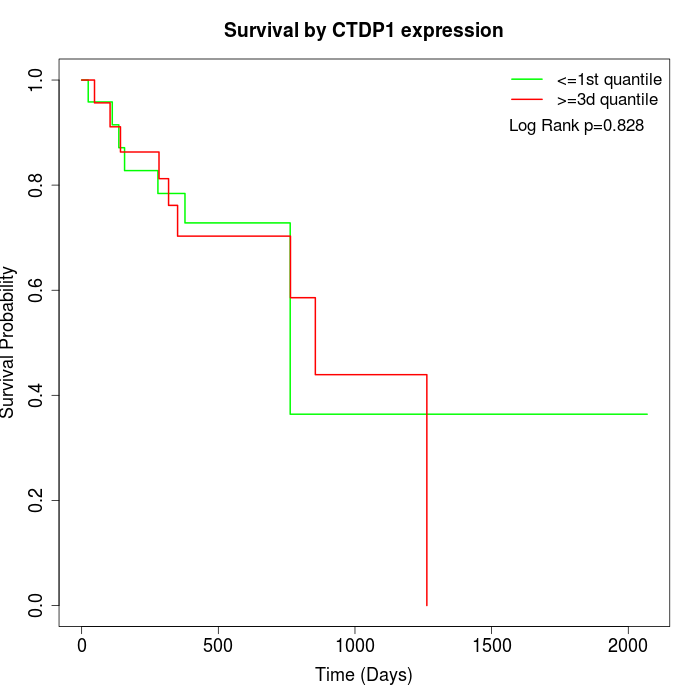 |
| GSE53622 | GSE53624 | TCGA |
Note: Click image to view full size file.
Copy number change of CTDP1:
| Dataset | Gene | EntrezID | Gain | Loss | Normal | Detail |
|---|---|---|---|---|---|---|
| GSE15526 | CTDP1 | 9150 | 1 | 12 | 17 | |
| GSE20123 | CTDP1 | 9150 | 1 | 12 | 17 | |
| GSE43470 | CTDP1 | 9150 | 0 | 12 | 31 | |
| GSE46452 | CTDP1 | 9150 | 1 | 26 | 32 | |
| GSE47630 | CTDP1 | 9150 | 5 | 22 | 13 | |
| GSE54993 | CTDP1 | 9150 | 9 | 0 | 61 | |
| GSE54994 | CTDP1 | 9150 | 1 | 19 | 33 | |
| GSE60625 | CTDP1 | 9150 | 0 | 4 | 7 | |
| GSE74703 | CTDP1 | 9150 | 0 | 8 | 28 | |
| GSE74704 | CTDP1 | 9150 | 0 | 9 | 11 | |
| TCGA | CTDP1 | 9150 | 7 | 45 | 44 |
Total number of gains: 25; Total number of losses: 169; Total Number of normals: 294.
Somatic mutations of CTDP1:
Generating mutation plots.
Highly correlated genes for CTDP1:
Showing top 20/52 corelated genes with mean PCC>0.5.
| Gene1 | Gene2 | Mean PCC | Num. Datasets | Num. PCC<0 | Num. PCC>0.5 |
|---|---|---|---|---|---|
| CTDP1 | SLC5A5 | 0.659842 | 4 | 0 | 4 |
| CTDP1 | MON1B | 0.654303 | 4 | 0 | 4 |
| CTDP1 | GPR150 | 0.649406 | 3 | 0 | 3 |
| CTDP1 | LRIT1 | 0.637339 | 4 | 0 | 3 |
| CTDP1 | SLC6A18 | 0.636942 | 3 | 0 | 3 |
| CTDP1 | CDC42EP5 | 0.633784 | 3 | 0 | 3 |
| CTDP1 | PGS1 | 0.631645 | 3 | 0 | 3 |
| CTDP1 | FZD9 | 0.624713 | 3 | 0 | 3 |
| CTDP1 | AJAP1 | 0.612844 | 3 | 0 | 3 |
| CTDP1 | HGD | 0.61172 | 5 | 0 | 3 |
| CTDP1 | MED16 | 0.602998 | 5 | 0 | 4 |
| CTDP1 | DPH2 | 0.595153 | 3 | 0 | 3 |
| CTDP1 | TMEM53 | 0.593991 | 4 | 0 | 3 |
| CTDP1 | TUSC1 | 0.591558 | 3 | 0 | 3 |
| CTDP1 | MTMR14 | 0.590888 | 5 | 0 | 3 |
| CTDP1 | IFFO1 | 0.590311 | 4 | 0 | 3 |
| CTDP1 | MIRLET7BHG | 0.58912 | 4 | 0 | 3 |
| CTDP1 | MTF1 | 0.582804 | 4 | 0 | 4 |
| CTDP1 | CHMP6 | 0.580327 | 5 | 0 | 3 |
| CTDP1 | SRRM3 | 0.577626 | 5 | 0 | 3 |
For details and further investigation, click here