| Full name: phosphatidylglycerophosphate synthase 1 | Alias Symbol: DKFZP762M186 | ||
| Type: protein-coding gene | Cytoband: 17q25.3 | ||
| Entrez ID: 9489 | HGNC ID: HGNC:30029 | Ensembl Gene: ENSG00000087157 | OMIM ID: 614942 |
Screen Evidence:
| |||
Expression of PGS1:
| Dataset | Gene | EntrezID | Probe | Log2FC | Adj.pValue | Expression |
|---|---|---|---|---|---|---|
| GSE17351 | PGS1 | 9489 | 219394_at | 0.5507 | 0.1733 | |
| GSE20347 | PGS1 | 9489 | 219394_at | 0.5859 | 0.0001 | |
| GSE23400 | PGS1 | 9489 | 219394_at | 0.2627 | 0.0000 | |
| GSE26886 | PGS1 | 9489 | 219394_at | 1.1477 | 0.0000 | |
| GSE29001 | PGS1 | 9489 | 219394_at | 0.7494 | 0.0023 | |
| GSE38129 | PGS1 | 9489 | 219394_at | 0.5619 | 0.0000 | |
| GSE45670 | PGS1 | 9489 | 219394_at | 0.3786 | 0.0069 | |
| GSE53622 | PGS1 | 9489 | 134411 | 0.5242 | 0.0000 | |
| GSE53624 | PGS1 | 9489 | 50947 | 0.6662 | 0.0000 | |
| GSE63941 | PGS1 | 9489 | 219394_at | -0.2322 | 0.5249 | |
| GSE77861 | PGS1 | 9489 | 226266_at | 0.1235 | 0.1547 | |
| GSE97050 | PGS1 | 9489 | A_23_P77833 | 0.7524 | 0.1299 | |
| SRP007169 | PGS1 | 9489 | RNAseq | 0.8660 | 0.0433 | |
| SRP008496 | PGS1 | 9489 | RNAseq | 0.6341 | 0.0309 | |
| SRP064894 | PGS1 | 9489 | RNAseq | 0.7664 | 0.0000 | |
| SRP133303 | PGS1 | 9489 | RNAseq | 0.7304 | 0.0000 | |
| SRP159526 | PGS1 | 9489 | RNAseq | 0.9143 | 0.0000 | |
| SRP193095 | PGS1 | 9489 | RNAseq | 0.9420 | 0.0000 | |
| SRP219564 | PGS1 | 9489 | RNAseq | 0.3784 | 0.0724 | |
| TCGA | PGS1 | 9489 | RNAseq | 0.1119 | 0.0406 |
Upregulated datasets: 1; Downregulated datasets: 0.
Survival by PGS1 expression:
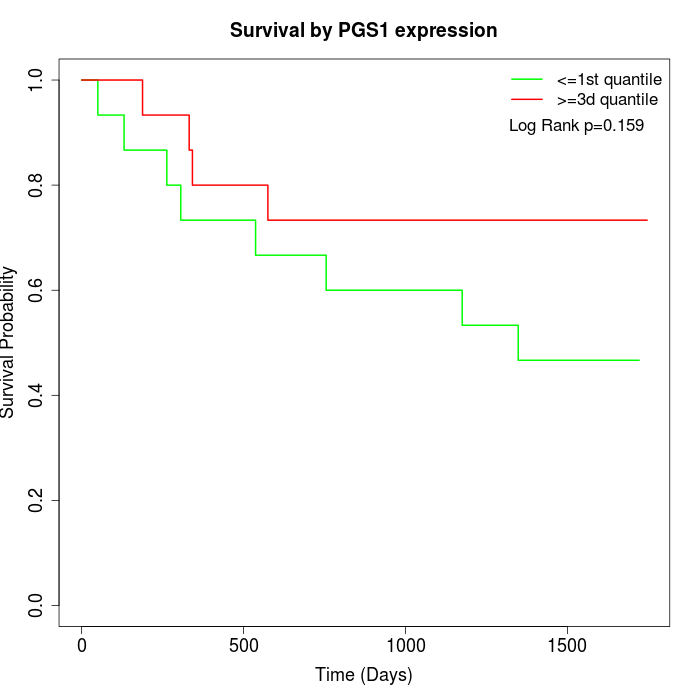 | 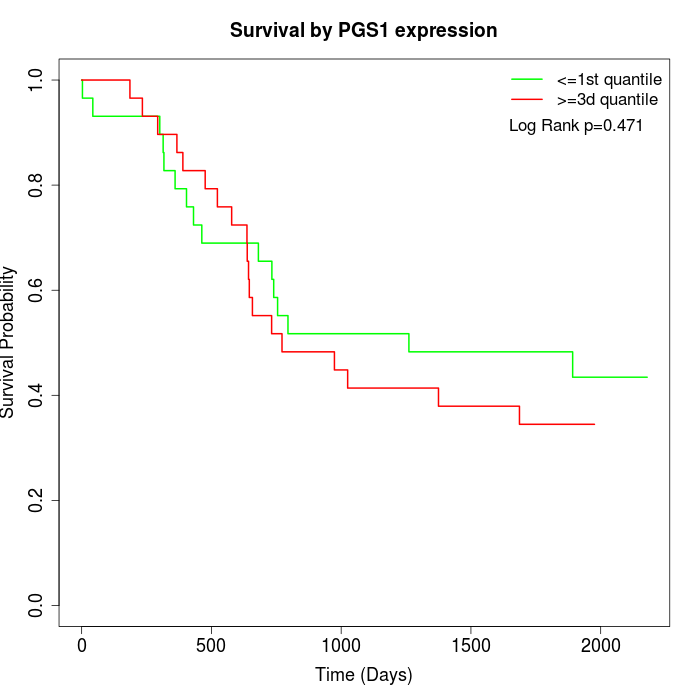 | 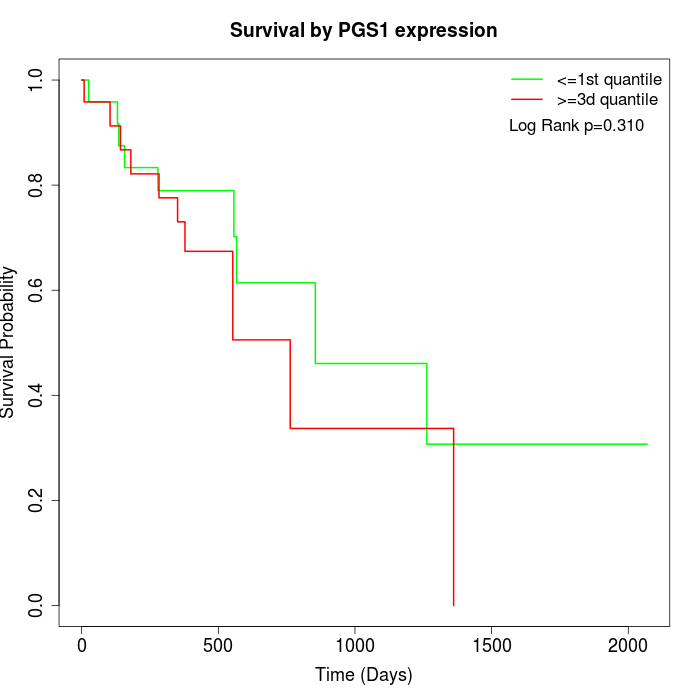 |
| GSE53622 | GSE53624 | TCGA |
Note: Click image to view full size file.
Copy number change of PGS1:
| Dataset | Gene | EntrezID | Gain | Loss | Normal | Detail |
|---|---|---|---|---|---|---|
| GSE15526 | PGS1 | 9489 | 5 | 4 | 21 | |
| GSE20123 | PGS1 | 9489 | 5 | 4 | 21 | |
| GSE43470 | PGS1 | 9489 | 3 | 4 | 36 | |
| GSE46452 | PGS1 | 9489 | 33 | 0 | 26 | |
| GSE47630 | PGS1 | 9489 | 8 | 1 | 31 | |
| GSE54993 | PGS1 | 9489 | 2 | 5 | 63 | |
| GSE54994 | PGS1 | 9489 | 10 | 4 | 39 | |
| GSE60625 | PGS1 | 9489 | 6 | 0 | 5 | |
| GSE74703 | PGS1 | 9489 | 3 | 2 | 31 | |
| GSE74704 | PGS1 | 9489 | 4 | 4 | 12 | |
| TCGA | PGS1 | 9489 | 30 | 9 | 57 |
Total number of gains: 109; Total number of losses: 37; Total Number of normals: 342.
Somatic mutations of PGS1:
Generating mutation plots.
Highly correlated genes for PGS1:
Showing top 20/1153 corelated genes with mean PCC>0.5.
| Gene1 | Gene2 | Mean PCC | Num. Datasets | Num. PCC<0 | Num. PCC>0.5 |
|---|---|---|---|---|---|
| PGS1 | LHX6 | 0.7497 | 3 | 0 | 3 |
| PGS1 | ALKBH6 | 0.734808 | 3 | 0 | 3 |
| PGS1 | MIB2 | 0.728689 | 3 | 0 | 3 |
| PGS1 | CHCHD6 | 0.715077 | 3 | 0 | 3 |
| PGS1 | FCHO1 | 0.714274 | 3 | 0 | 3 |
| PGS1 | CDC37 | 0.713395 | 3 | 0 | 3 |
| PGS1 | LRRC58 | 0.711888 | 4 | 0 | 4 |
| PGS1 | SENP1 | 0.690369 | 3 | 0 | 3 |
| PGS1 | SIX4 | 0.687536 | 6 | 0 | 5 |
| PGS1 | CD276 | 0.685959 | 5 | 0 | 5 |
| PGS1 | COMMD2 | 0.673063 | 4 | 0 | 4 |
| PGS1 | F11R | 0.672473 | 4 | 0 | 4 |
| PGS1 | CHTF18 | 0.669735 | 5 | 0 | 5 |
| PGS1 | MRPS23 | 0.669552 | 6 | 0 | 6 |
| PGS1 | WDR54 | 0.667738 | 5 | 0 | 5 |
| PGS1 | TNFAIP8L1 | 0.666386 | 4 | 0 | 3 |
| PGS1 | EDARADD | 0.659419 | 4 | 0 | 3 |
| PGS1 | COLGALT1 | 0.658305 | 9 | 0 | 8 |
| PGS1 | DDHD1 | 0.65744 | 5 | 0 | 5 |
| PGS1 | DHX36 | 0.656242 | 5 | 0 | 5 |
For details and further investigation, click here