| Full name: catenin beta interacting protein 1 | Alias Symbol: ICAT|MGC15093 | ||
| Type: protein-coding gene | Cytoband: 1p36.22 | ||
| Entrez ID: 56998 | HGNC ID: HGNC:16913 | Ensembl Gene: ENSG00000178585 | OMIM ID: 607758 |
CTNNBIP1 involved pathways:
| KEGG pathway | Description | View |
|---|---|---|
| hsa04310 | Wnt signaling pathway |
Expression of CTNNBIP1:
| Dataset | Gene | EntrezID | Probe | Log2FC | Adj.pValue | Expression |
|---|---|---|---|---|---|---|
| GSE17351 | CTNNBIP1 | 56998 | 203081_at | -0.3183 | 0.6950 | |
| GSE20347 | CTNNBIP1 | 56998 | 203081_at | -0.8165 | 0.0000 | |
| GSE23400 | CTNNBIP1 | 56998 | 203081_at | -0.4499 | 0.0000 | |
| GSE26886 | CTNNBIP1 | 56998 | 203081_at | -0.1413 | 0.6890 | |
| GSE29001 | CTNNBIP1 | 56998 | 203081_at | -0.6070 | 0.0068 | |
| GSE38129 | CTNNBIP1 | 56998 | 203081_at | -0.5313 | 0.0012 | |
| GSE45670 | CTNNBIP1 | 56998 | 203081_at | -0.6450 | 0.0007 | |
| GSE53622 | CTNNBIP1 | 56998 | 31089 | -1.2908 | 0.0000 | |
| GSE53624 | CTNNBIP1 | 56998 | 31089 | -1.7159 | 0.0000 | |
| GSE63941 | CTNNBIP1 | 56998 | 203081_at | 0.3832 | 0.3582 | |
| GSE77861 | CTNNBIP1 | 56998 | 203081_at | -0.6248 | 0.0009 | |
| GSE97050 | CTNNBIP1 | 56998 | A_33_P3286293 | -0.0303 | 0.9567 | |
| SRP007169 | CTNNBIP1 | 56998 | RNAseq | -2.6283 | 0.0000 | |
| SRP008496 | CTNNBIP1 | 56998 | RNAseq | -2.0042 | 0.0000 | |
| SRP064894 | CTNNBIP1 | 56998 | RNAseq | -1.5698 | 0.0000 | |
| SRP133303 | CTNNBIP1 | 56998 | RNAseq | -1.5711 | 0.0000 | |
| SRP159526 | CTNNBIP1 | 56998 | RNAseq | -1.6168 | 0.0000 | |
| SRP193095 | CTNNBIP1 | 56998 | RNAseq | -1.7203 | 0.0000 | |
| SRP219564 | CTNNBIP1 | 56998 | RNAseq | -1.9719 | 0.0016 | |
| TCGA | CTNNBIP1 | 56998 | RNAseq | 0.0198 | 0.7855 |
Upregulated datasets: 0; Downregulated datasets: 9.
Survival by CTNNBIP1 expression:
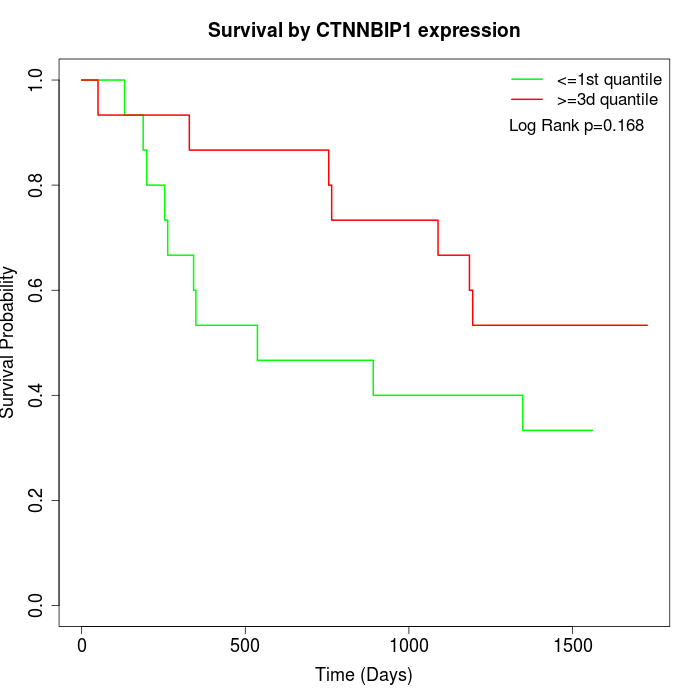 | 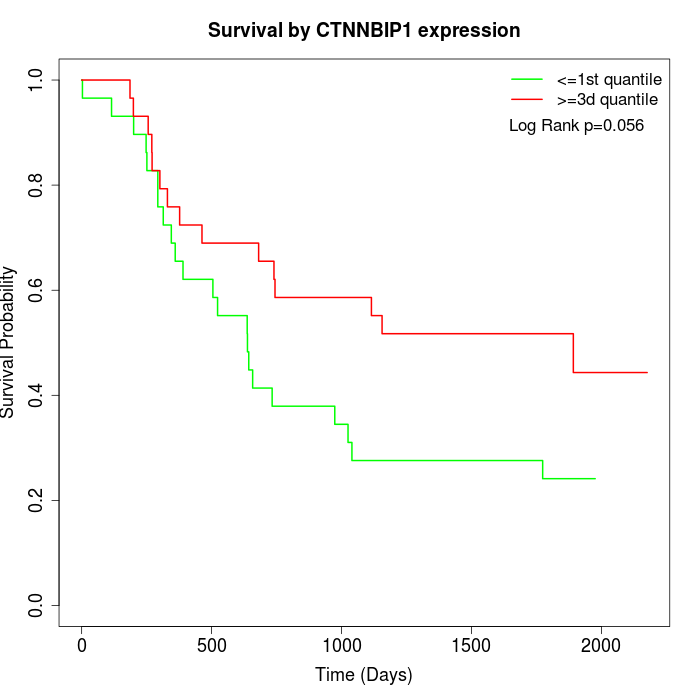 | 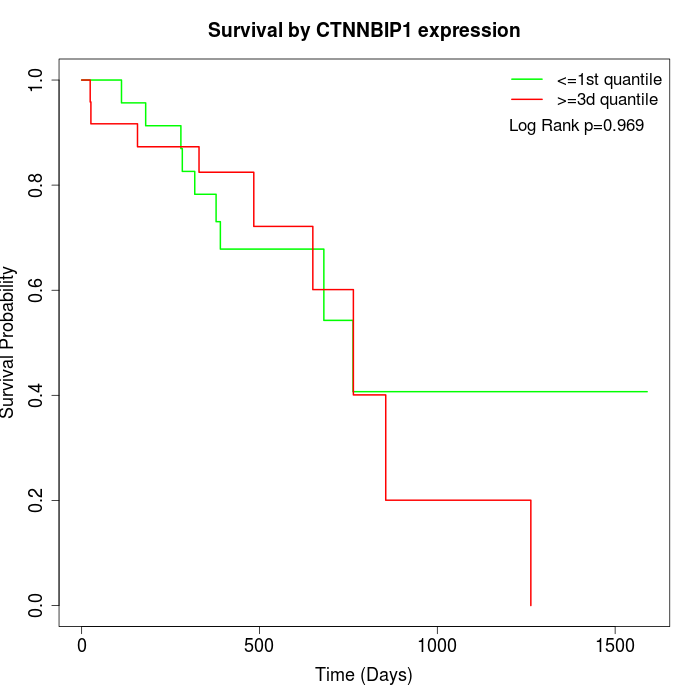 |
| GSE53622 | GSE53624 | TCGA |
Note: Click image to view full size file.
Copy number change of CTNNBIP1:
| Dataset | Gene | EntrezID | Gain | Loss | Normal | Detail |
|---|---|---|---|---|---|---|
| GSE15526 | CTNNBIP1 | 56998 | 0 | 5 | 25 | |
| GSE20123 | CTNNBIP1 | 56998 | 0 | 3 | 27 | |
| GSE43470 | CTNNBIP1 | 56998 | 6 | 5 | 32 | |
| GSE46452 | CTNNBIP1 | 56998 | 7 | 1 | 51 | |
| GSE47630 | CTNNBIP1 | 56998 | 8 | 4 | 28 | |
| GSE54993 | CTNNBIP1 | 56998 | 3 | 1 | 66 | |
| GSE54994 | CTNNBIP1 | 56998 | 12 | 4 | 37 | |
| GSE60625 | CTNNBIP1 | 56998 | 0 | 0 | 11 | |
| GSE74703 | CTNNBIP1 | 56998 | 5 | 3 | 28 | |
| GSE74704 | CTNNBIP1 | 56998 | 0 | 0 | 20 | |
| TCGA | CTNNBIP1 | 56998 | 9 | 25 | 62 |
Total number of gains: 50; Total number of losses: 51; Total Number of normals: 387.
Somatic mutations of CTNNBIP1:
Generating mutation plots.
Highly correlated genes for CTNNBIP1:
Showing top 20/1308 corelated genes with mean PCC>0.5.
| Gene1 | Gene2 | Mean PCC | Num. Datasets | Num. PCC<0 | Num. PCC>0.5 |
|---|---|---|---|---|---|
| CTNNBIP1 | NCCRP1 | 0.844876 | 3 | 0 | 3 |
| CTNNBIP1 | UPK3B | 0.812326 | 3 | 0 | 3 |
| CTNNBIP1 | SPRR2D | 0.804945 | 3 | 0 | 3 |
| CTNNBIP1 | SPRR2F | 0.80347 | 3 | 0 | 3 |
| CTNNBIP1 | ARAP2 | 0.795443 | 3 | 0 | 3 |
| CTNNBIP1 | SPRR2E | 0.793134 | 3 | 0 | 3 |
| CTNNBIP1 | SPRR2B | 0.790474 | 3 | 0 | 3 |
| CTNNBIP1 | NIPAL1 | 0.781416 | 3 | 0 | 3 |
| CTNNBIP1 | EPGN | 0.7805 | 3 | 0 | 3 |
| CTNNBIP1 | SPRR2A | 0.779141 | 3 | 0 | 3 |
| CTNNBIP1 | TMPRSS11A | 0.770642 | 3 | 0 | 3 |
| CTNNBIP1 | DMKN | 0.763524 | 3 | 0 | 3 |
| CTNNBIP1 | RNF222 | 0.762009 | 3 | 0 | 3 |
| CTNNBIP1 | NUAK2 | 0.758941 | 3 | 0 | 3 |
| CTNNBIP1 | GRHL3 | 0.749445 | 6 | 0 | 6 |
| CTNNBIP1 | SBSN | 0.745861 | 4 | 0 | 4 |
| CTNNBIP1 | KPRP | 0.742354 | 3 | 0 | 3 |
| CTNNBIP1 | C5orf66-AS1 | 0.74134 | 5 | 0 | 5 |
| CTNNBIP1 | SMAGP | 0.73913 | 10 | 0 | 9 |
| CTNNBIP1 | GJB6 | 0.732258 | 3 | 0 | 3 |
For details and further investigation, click here