| Full name: cathepsin A | Alias Symbol: | ||
| Type: protein-coding gene | Cytoband: 20q13.12 | ||
| Entrez ID: 5476 | HGNC ID: HGNC:9251 | Ensembl Gene: ENSG00000064601 | OMIM ID: 613111 |
| Related drugs: BOCEPREVIR, TELAPREVIR... [more] | |||
Expression of CTSA:
| Dataset | Gene | EntrezID | Probe | Log2FC | Adj.pValue | Expression |
|---|---|---|---|---|---|---|
| GSE17351 | CTSA | 5476 | 200661_at | 0.5951 | 0.1600 | |
| GSE20347 | CTSA | 5476 | 200661_at | 0.0076 | 0.9705 | |
| GSE23400 | CTSA | 5476 | 200661_at | 0.1411 | 0.0433 | |
| GSE26886 | CTSA | 5476 | 200661_at | -0.5135 | 0.0255 | |
| GSE29001 | CTSA | 5476 | 200661_at | 0.0529 | 0.8873 | |
| GSE38129 | CTSA | 5476 | 200661_at | 0.1554 | 0.2743 | |
| GSE45670 | CTSA | 5476 | 200661_at | 0.5146 | 0.0003 | |
| GSE53622 | CTSA | 5476 | 8315 | 0.4806 | 0.0000 | |
| GSE53624 | CTSA | 5476 | 8315 | 0.3417 | 0.0000 | |
| GSE63941 | CTSA | 5476 | 200661_at | -0.8388 | 0.2684 | |
| GSE77861 | CTSA | 5476 | 200661_at | -0.0808 | 0.7425 | |
| GSE97050 | CTSA | 5476 | A_33_P3280213 | 1.0311 | 0.0786 | |
| SRP007169 | CTSA | 5476 | RNAseq | -1.0128 | 0.0184 | |
| SRP008496 | CTSA | 5476 | RNAseq | -0.8007 | 0.0055 | |
| SRP064894 | CTSA | 5476 | RNAseq | 0.8449 | 0.0000 | |
| SRP133303 | CTSA | 5476 | RNAseq | 0.7075 | 0.0000 | |
| SRP159526 | CTSA | 5476 | RNAseq | 0.2238 | 0.2834 | |
| SRP193095 | CTSA | 5476 | RNAseq | 0.0296 | 0.8528 | |
| SRP219564 | CTSA | 5476 | RNAseq | 0.6581 | 0.0636 | |
| TCGA | CTSA | 5476 | RNAseq | 0.0866 | 0.0483 |
Upregulated datasets: 0; Downregulated datasets: 1.
Survival by CTSA expression:
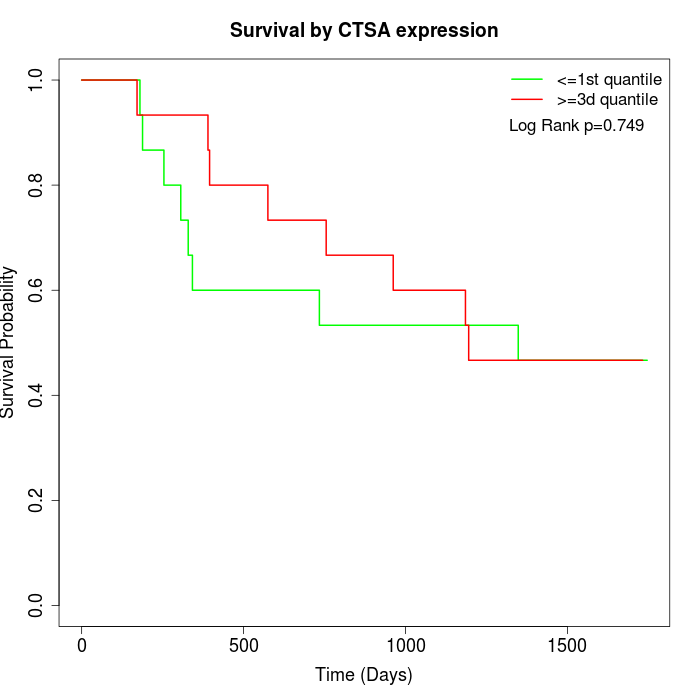 | 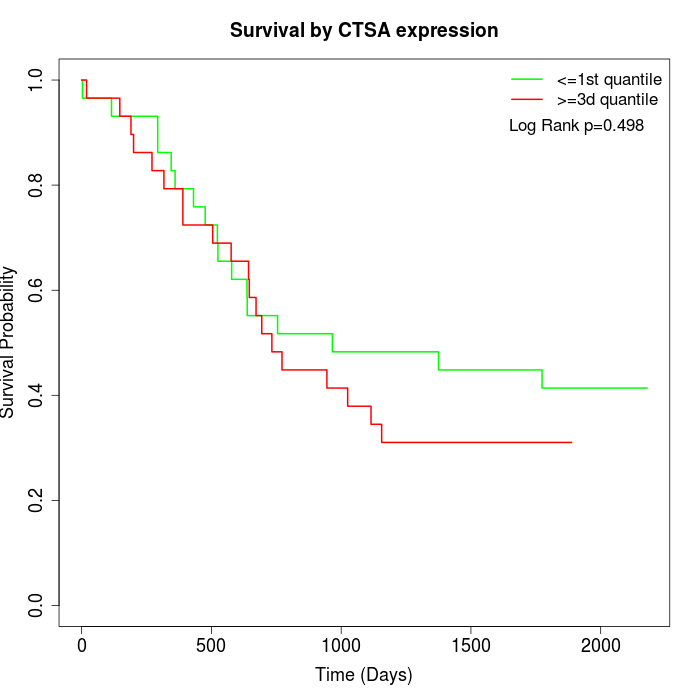 | 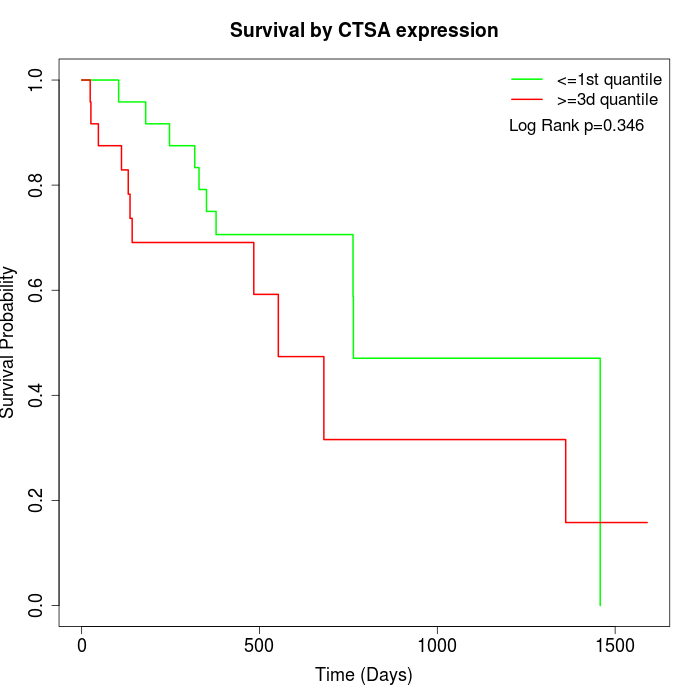 |
| GSE53622 | GSE53624 | TCGA |
Note: Click image to view full size file.
Copy number change of CTSA:
| Dataset | Gene | EntrezID | Gain | Loss | Normal | Detail |
|---|---|---|---|---|---|---|
| GSE15526 | CTSA | 5476 | 14 | 1 | 15 | |
| GSE20123 | CTSA | 5476 | 14 | 1 | 15 | |
| GSE43470 | CTSA | 5476 | 12 | 1 | 30 | |
| GSE46452 | CTSA | 5476 | 29 | 0 | 30 | |
| GSE47630 | CTSA | 5476 | 24 | 1 | 15 | |
| GSE54993 | CTSA | 5476 | 0 | 17 | 53 | |
| GSE54994 | CTSA | 5476 | 25 | 0 | 28 | |
| GSE60625 | CTSA | 5476 | 0 | 0 | 11 | |
| GSE74703 | CTSA | 5476 | 10 | 1 | 25 | |
| GSE74704 | CTSA | 5476 | 10 | 0 | 10 | |
| TCGA | CTSA | 5476 | 46 | 3 | 47 |
Total number of gains: 184; Total number of losses: 25; Total Number of normals: 279.
Somatic mutations of CTSA:
Generating mutation plots.
Highly correlated genes for CTSA:
Showing top 20/283 corelated genes with mean PCC>0.5.
| Gene1 | Gene2 | Mean PCC | Num. Datasets | Num. PCC<0 | Num. PCC>0.5 |
|---|---|---|---|---|---|
| CTSA | IKZF1 | 0.675679 | 3 | 0 | 3 |
| CTSA | HSP90AA1 | 0.651062 | 3 | 0 | 3 |
| CTSA | GAGE1 | 0.633159 | 3 | 0 | 3 |
| CTSA | TXNDC12 | 0.622579 | 5 | 0 | 3 |
| CTSA | FAM110A | 0.621284 | 5 | 0 | 4 |
| CTSA | SDF4 | 0.618907 | 7 | 0 | 6 |
| CTSA | ASPRV1 | 0.616611 | 5 | 0 | 3 |
| CTSA | ASB13 | 0.61467 | 4 | 0 | 3 |
| CTSA | ACOT7 | 0.61267 | 6 | 0 | 4 |
| CTSA | PMM2 | 0.612333 | 4 | 0 | 3 |
| CTSA | YKT6 | 0.609678 | 4 | 0 | 3 |
| CTSA | MMP12 | 0.607235 | 5 | 0 | 4 |
| CTSA | CCNF | 0.607036 | 5 | 0 | 4 |
| CTSA | LOX | 0.606961 | 6 | 0 | 5 |
| CTSA | PIGU | 0.606588 | 6 | 0 | 5 |
| CTSA | DARS2 | 0.605254 | 4 | 0 | 3 |
| CTSA | SIGMAR1 | 0.605 | 3 | 0 | 3 |
| CTSA | DDX41 | 0.604717 | 5 | 0 | 3 |
| CTSA | TTYH3 | 0.604228 | 5 | 0 | 4 |
| CTSA | TBX1 | 0.603954 | 4 | 0 | 3 |
For details and further investigation, click here