| Full name: dpy-19 like C-mannosyltransferase 1 | Alias Symbol: KIAA0877 | ||
| Type: protein-coding gene | Cytoband: 7p14.2 | ||
| Entrez ID: 23333 | HGNC ID: HGNC:22205 | Ensembl Gene: ENSG00000173852 | OMIM ID: 613892 |
Expression of DPY19L1:
| Dataset | Gene | EntrezID | Probe | Log2FC | Adj.pValue | Expression |
|---|---|---|---|---|---|---|
| GSE17351 | DPY19L1 | 23333 | 212792_at | 0.6827 | 0.1833 | |
| GSE20347 | DPY19L1 | 23333 | 212792_at | 0.9996 | 0.0000 | |
| GSE23400 | DPY19L1 | 23333 | 212792_at | 0.7077 | 0.0000 | |
| GSE26886 | DPY19L1 | 23333 | 212792_at | 1.6419 | 0.0000 | |
| GSE29001 | DPY19L1 | 23333 | 212792_at | 1.2557 | 0.0057 | |
| GSE38129 | DPY19L1 | 23333 | 212792_at | 1.0999 | 0.0000 | |
| GSE45670 | DPY19L1 | 23333 | 212792_at | 0.6466 | 0.0260 | |
| GSE53622 | DPY19L1 | 23333 | 17913 | 0.9811 | 0.0000 | |
| GSE53624 | DPY19L1 | 23333 | 17913 | 1.3750 | 0.0000 | |
| GSE63941 | DPY19L1 | 23333 | 212792_at | -1.7335 | 0.0034 | |
| GSE77861 | DPY19L1 | 23333 | 212792_at | 0.9931 | 0.0065 | |
| GSE97050 | DPY19L1 | 23333 | A_23_P394448 | 1.0916 | 0.0555 | |
| SRP007169 | DPY19L1 | 23333 | RNAseq | 1.8534 | 0.0000 | |
| SRP008496 | DPY19L1 | 23333 | RNAseq | 2.3373 | 0.0000 | |
| SRP064894 | DPY19L1 | 23333 | RNAseq | 1.0998 | 0.0000 | |
| SRP133303 | DPY19L1 | 23333 | RNAseq | 1.2841 | 0.0000 | |
| SRP159526 | DPY19L1 | 23333 | RNAseq | 1.1399 | 0.0001 | |
| SRP193095 | DPY19L1 | 23333 | RNAseq | 0.7895 | 0.0000 | |
| SRP219564 | DPY19L1 | 23333 | RNAseq | 0.9816 | 0.0007 | |
| TCGA | DPY19L1 | 23333 | RNAseq | 0.1911 | 0.0115 |
Upregulated datasets: 9; Downregulated datasets: 1.
Survival by DPY19L1 expression:
 | 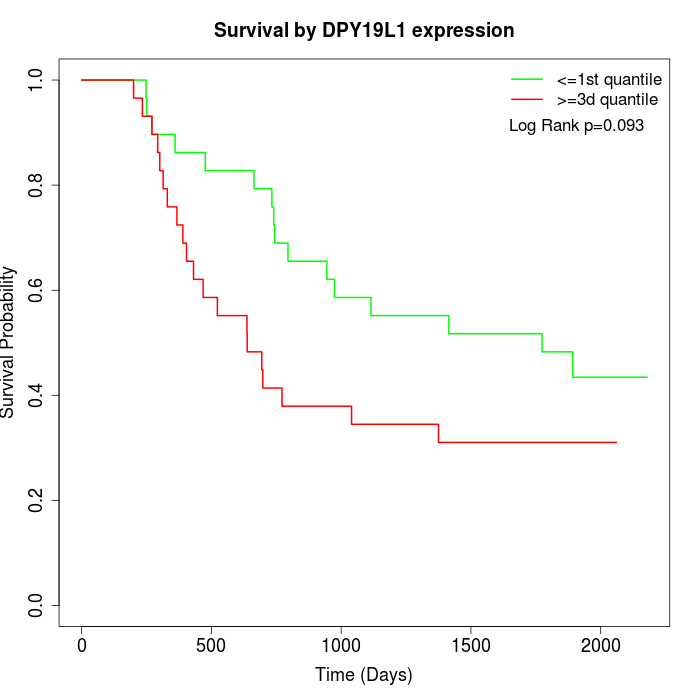 | 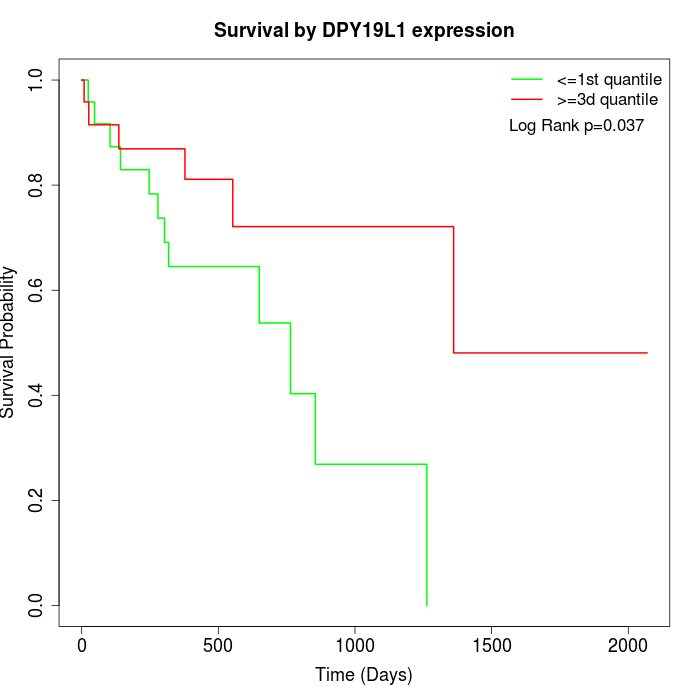 |
| GSE53622 | GSE53624 | TCGA |
Note: Click image to view full size file.
Copy number change of DPY19L1:
| Dataset | Gene | EntrezID | Gain | Loss | Normal | Detail |
|---|---|---|---|---|---|---|
| GSE15526 | DPY19L1 | 23333 | 16 | 0 | 14 | |
| GSE20123 | DPY19L1 | 23333 | 16 | 0 | 14 | |
| GSE43470 | DPY19L1 | 23333 | 4 | 0 | 39 | |
| GSE46452 | DPY19L1 | 23333 | 11 | 1 | 47 | |
| GSE47630 | DPY19L1 | 23333 | 8 | 1 | 31 | |
| GSE54993 | DPY19L1 | 23333 | 0 | 7 | 63 | |
| GSE54994 | DPY19L1 | 23333 | 20 | 2 | 31 | |
| GSE60625 | DPY19L1 | 23333 | 0 | 0 | 11 | |
| GSE74703 | DPY19L1 | 23333 | 4 | 0 | 32 | |
| GSE74704 | DPY19L1 | 23333 | 10 | 0 | 10 | |
| TCGA | DPY19L1 | 23333 | 56 | 6 | 34 |
Total number of gains: 145; Total number of losses: 17; Total Number of normals: 326.
Somatic mutations of DPY19L1:
Generating mutation plots.
Highly correlated genes for DPY19L1:
Showing top 20/1699 corelated genes with mean PCC>0.5.
| Gene1 | Gene2 | Mean PCC | Num. Datasets | Num. PCC<0 | Num. PCC>0.5 |
|---|---|---|---|---|---|
| DPY19L1 | ZCCHC24 | 0.813583 | 3 | 0 | 3 |
| DPY19L1 | PYCR2 | 0.787822 | 3 | 0 | 3 |
| DPY19L1 | WDR81 | 0.77239 | 4 | 0 | 4 |
| DPY19L1 | XPR1 | 0.771082 | 7 | 0 | 7 |
| DPY19L1 | LRRC8C | 0.768569 | 3 | 0 | 3 |
| DPY19L1 | WDR54 | 0.76412 | 7 | 0 | 7 |
| DPY19L1 | LRP12 | 0.758543 | 12 | 0 | 11 |
| DPY19L1 | LPCAT1 | 0.753216 | 12 | 0 | 12 |
| DPY19L1 | FADS1 | 0.751705 | 4 | 0 | 4 |
| DPY19L1 | SPON2 | 0.750823 | 3 | 0 | 3 |
| DPY19L1 | ACVR1 | 0.750692 | 12 | 0 | 11 |
| DPY19L1 | CCL2 | 0.749075 | 3 | 0 | 3 |
| DPY19L1 | NF1 | 0.7464 | 3 | 0 | 3 |
| DPY19L1 | PXDN | 0.745489 | 12 | 0 | 12 |
| DPY19L1 | MICAL1 | 0.740971 | 3 | 0 | 3 |
| DPY19L1 | SLC39A14 | 0.74021 | 12 | 0 | 12 |
| DPY19L1 | ITGAV | 0.738795 | 12 | 0 | 12 |
| DPY19L1 | TTL | 0.737552 | 8 | 0 | 8 |
| DPY19L1 | TMEM200A | 0.733373 | 4 | 0 | 4 |
| DPY19L1 | BID | 0.730761 | 10 | 0 | 10 |
For details and further investigation, click here