| Full name: elastin microfibril interfacer 1 | Alias Symbol: DKFZp586M121|gp115 | ||
| Type: protein-coding gene | Cytoband: 2p23.3 | ||
| Entrez ID: 11117 | HGNC ID: HGNC:19880 | Ensembl Gene: ENSG00000138080 | OMIM ID: 130660 |
Expression of EMILIN1:
| Dataset | Gene | EntrezID | Probe | Log2FC | Adj.pValue | Expression |
|---|---|---|---|---|---|---|
| GSE17351 | EMILIN1 | 11117 | 204163_at | -0.2731 | 0.7649 | |
| GSE20347 | EMILIN1 | 11117 | 204163_at | 0.4625 | 0.0191 | |
| GSE23400 | EMILIN1 | 11117 | 204163_at | -0.0709 | 0.6921 | |
| GSE26886 | EMILIN1 | 11117 | 204163_at | 0.7986 | 0.0020 | |
| GSE29001 | EMILIN1 | 11117 | 204163_at | 0.3256 | 0.3312 | |
| GSE38129 | EMILIN1 | 11117 | 204163_at | 0.3286 | 0.4810 | |
| GSE45670 | EMILIN1 | 11117 | 204163_at | -0.6811 | 0.0111 | |
| GSE53622 | EMILIN1 | 11117 | 104045 | 0.2036 | 0.0353 | |
| GSE53624 | EMILIN1 | 11117 | 104045 | 0.4175 | 0.0000 | |
| GSE63941 | EMILIN1 | 11117 | 204163_at | -3.4467 | 0.0000 | |
| GSE77861 | EMILIN1 | 11117 | 204163_at | 0.1442 | 0.5483 | |
| GSE97050 | EMILIN1 | 11117 | A_33_P3333455 | 0.0402 | 0.8915 | |
| SRP007169 | EMILIN1 | 11117 | RNAseq | 3.9285 | 0.0000 | |
| SRP008496 | EMILIN1 | 11117 | RNAseq | 4.3495 | 0.0000 | |
| SRP064894 | EMILIN1 | 11117 | RNAseq | 1.8523 | 0.0000 | |
| SRP133303 | EMILIN1 | 11117 | RNAseq | 0.7345 | 0.0391 | |
| SRP159526 | EMILIN1 | 11117 | RNAseq | 0.6333 | 0.1878 | |
| SRP193095 | EMILIN1 | 11117 | RNAseq | 1.2632 | 0.0043 | |
| SRP219564 | EMILIN1 | 11117 | RNAseq | 0.1561 | 0.8639 | |
| TCGA | EMILIN1 | 11117 | RNAseq | -0.2190 | 0.0767 |
Upregulated datasets: 4; Downregulated datasets: 1.
Survival by EMILIN1 expression:
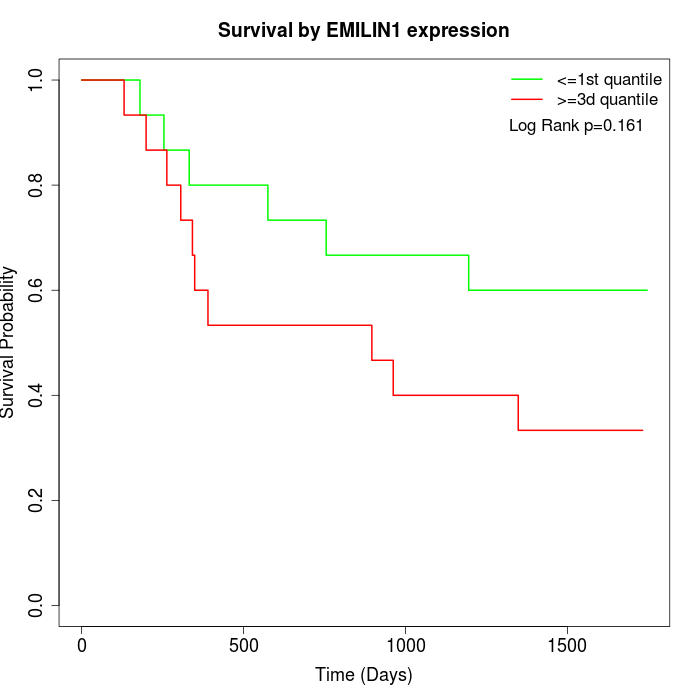 | 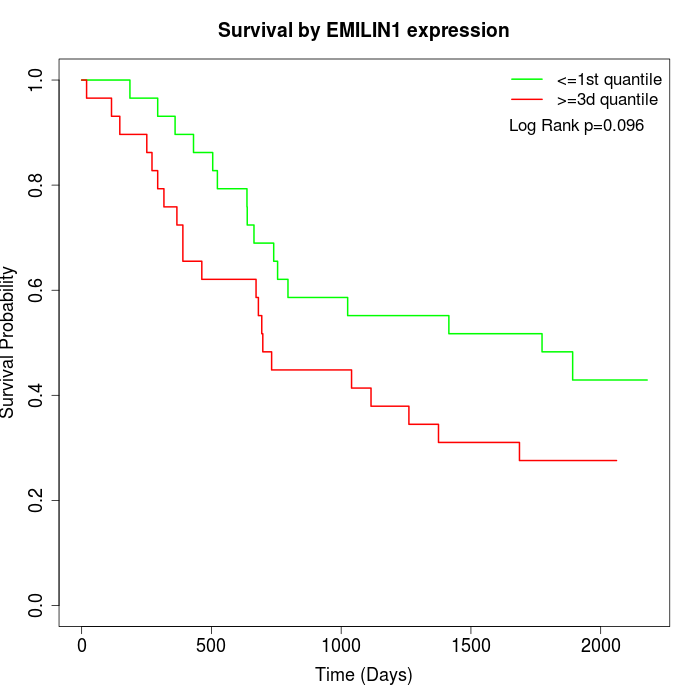 | 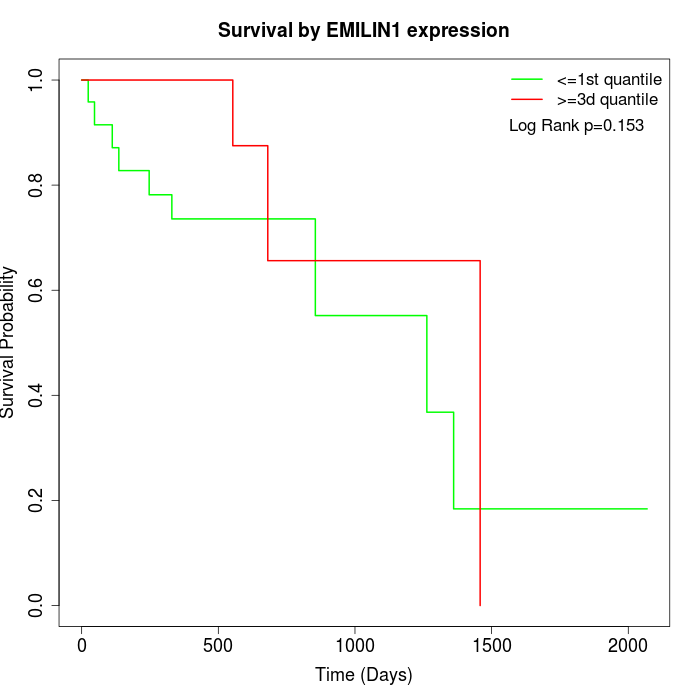 |
| GSE53622 | GSE53624 | TCGA |
Note: Click image to view full size file.
Copy number change of EMILIN1:
| Dataset | Gene | EntrezID | Gain | Loss | Normal | Detail |
|---|---|---|---|---|---|---|
| GSE15526 | EMILIN1 | 11117 | 11 | 2 | 17 | |
| GSE20123 | EMILIN1 | 11117 | 11 | 2 | 17 | |
| GSE43470 | EMILIN1 | 11117 | 3 | 1 | 39 | |
| GSE46452 | EMILIN1 | 11117 | 3 | 4 | 52 | |
| GSE47630 | EMILIN1 | 11117 | 8 | 0 | 32 | |
| GSE54993 | EMILIN1 | 11117 | 0 | 6 | 64 | |
| GSE54994 | EMILIN1 | 11117 | 10 | 0 | 43 | |
| GSE60625 | EMILIN1 | 11117 | 0 | 3 | 8 | |
| GSE74703 | EMILIN1 | 11117 | 3 | 0 | 33 | |
| GSE74704 | EMILIN1 | 11117 | 9 | 1 | 10 | |
| TCGA | EMILIN1 | 11117 | 37 | 2 | 57 |
Total number of gains: 95; Total number of losses: 21; Total Number of normals: 372.
Somatic mutations of EMILIN1:
Generating mutation plots.
Highly correlated genes for EMILIN1:
Showing top 20/525 corelated genes with mean PCC>0.5.
| Gene1 | Gene2 | Mean PCC | Num. Datasets | Num. PCC<0 | Num. PCC>0.5 |
|---|---|---|---|---|---|
| EMILIN1 | RARRES2 | 0.759424 | 13 | 0 | 13 |
| EMILIN1 | DNM3OS | 0.758881 | 4 | 0 | 4 |
| EMILIN1 | TCEAL7 | 0.757956 | 8 | 0 | 8 |
| EMILIN1 | RBM43 | 0.752136 | 3 | 0 | 3 |
| EMILIN1 | SETDB2 | 0.750528 | 3 | 0 | 3 |
| EMILIN1 | HEPH | 0.742197 | 11 | 0 | 10 |
| EMILIN1 | SCN9A | 0.730613 | 3 | 0 | 3 |
| EMILIN1 | PMP22 | 0.729388 | 11 | 0 | 11 |
| EMILIN1 | DDR2 | 0.723292 | 12 | 0 | 10 |
| EMILIN1 | FBN1 | 0.718028 | 10 | 0 | 10 |
| EMILIN1 | ISLR | 0.717764 | 12 | 0 | 12 |
| EMILIN1 | FAT4 | 0.715136 | 7 | 0 | 6 |
| EMILIN1 | ANK2 | 0.708146 | 5 | 0 | 5 |
| EMILIN1 | MXRA8 | 0.705366 | 11 | 0 | 10 |
| EMILIN1 | PCOLCE | 0.704568 | 12 | 0 | 12 |
| EMILIN1 | MMP23B | 0.700927 | 3 | 0 | 3 |
| EMILIN1 | PLN | 0.698533 | 6 | 0 | 6 |
| EMILIN1 | DCHS1 | 0.696984 | 10 | 0 | 8 |
| EMILIN1 | COL6A1 | 0.69698 | 12 | 0 | 11 |
| EMILIN1 | SCARF2 | 0.696308 | 5 | 0 | 5 |
For details and further investigation, click here