| Full name: endothelial PAS domain protein 1 | Alias Symbol: MOP2|PASD2|HIF2A|HLF|bHLHe73 | ||
| Type: protein-coding gene | Cytoband: 2p21 | ||
| Entrez ID: 2034 | HGNC ID: HGNC:3374 | Ensembl Gene: ENSG00000116016 | OMIM ID: 603349 |
Screen Evidence:
| |||
EPAS1 involved pathways:
| KEGG pathway | Description | View |
|---|---|---|
| hsa05200 | Pathways in cancer | |
| hsa05211 | Renal cell carcinoma |
Expression of EPAS1:
| Dataset | Gene | EntrezID | Probe | Log2FC | Adj.pValue | Expression |
|---|---|---|---|---|---|---|
| GSE17351 | EPAS1 | 2034 | 200878_at | -0.0490 | 0.9496 | |
| GSE20347 | EPAS1 | 2034 | 200878_at | -0.2755 | 0.2984 | |
| GSE23400 | EPAS1 | 2034 | 200878_at | 0.0130 | 0.9124 | |
| GSE26886 | EPAS1 | 2034 | 200878_at | -0.0282 | 0.9358 | |
| GSE29001 | EPAS1 | 2034 | 200878_at | -0.0897 | 0.8026 | |
| GSE38129 | EPAS1 | 2034 | 200878_at | -0.4753 | 0.0789 | |
| GSE45670 | EPAS1 | 2034 | 200878_at | -0.2451 | 0.1855 | |
| GSE53622 | EPAS1 | 2034 | 69318 | -0.5716 | 0.0000 | |
| GSE53624 | EPAS1 | 2034 | 69318 | -0.4673 | 0.0000 | |
| GSE63941 | EPAS1 | 2034 | 200878_at | -3.6963 | 0.0188 | |
| GSE77861 | EPAS1 | 2034 | 200878_at | 0.3978 | 0.3282 | |
| GSE97050 | EPAS1 | 2034 | A_23_P210210 | 0.2664 | 0.3936 | |
| SRP007169 | EPAS1 | 2034 | RNAseq | 0.1532 | 0.7706 | |
| SRP008496 | EPAS1 | 2034 | RNAseq | 0.3143 | 0.4029 | |
| SRP064894 | EPAS1 | 2034 | RNAseq | 0.2056 | 0.4725 | |
| SRP133303 | EPAS1 | 2034 | RNAseq | -0.2227 | 0.2972 | |
| SRP159526 | EPAS1 | 2034 | RNAseq | -0.7226 | 0.1418 | |
| SRP193095 | EPAS1 | 2034 | RNAseq | 0.4824 | 0.0008 | |
| SRP219564 | EPAS1 | 2034 | RNAseq | -0.1444 | 0.5146 | |
| TCGA | EPAS1 | 2034 | RNAseq | -0.2228 | 0.0007 |
Upregulated datasets: 0; Downregulated datasets: 1.
Survival by EPAS1 expression:
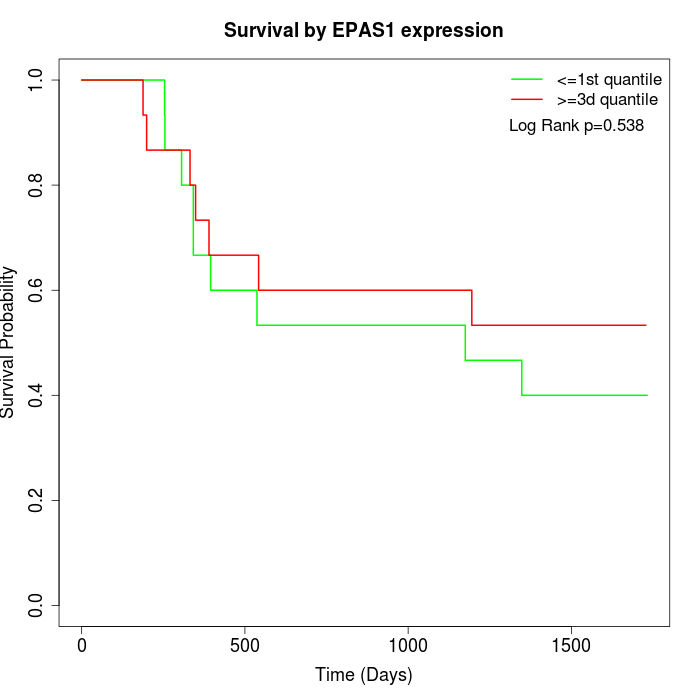 | 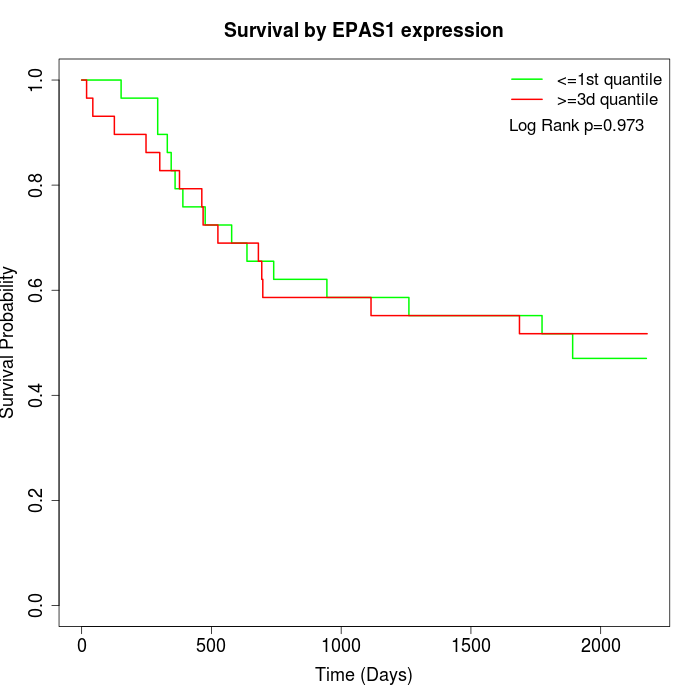 | 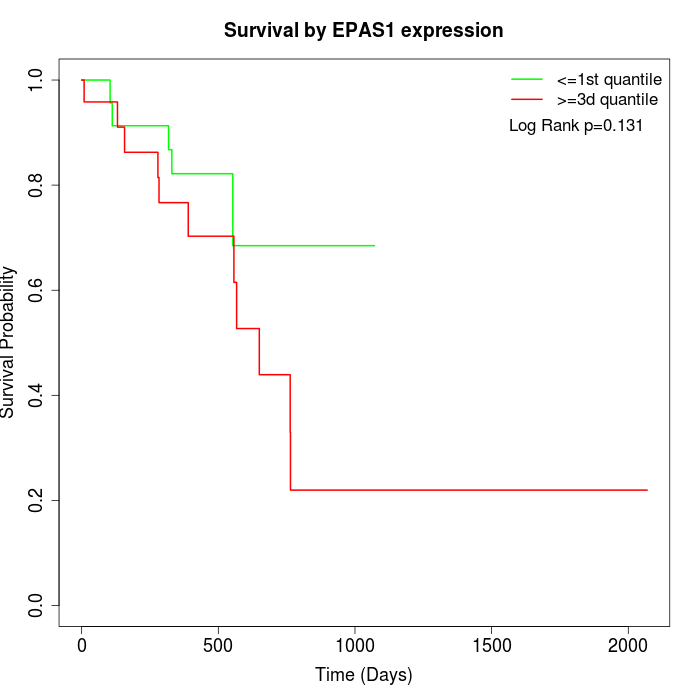 |
| GSE53622 | GSE53624 | TCGA |
Note: Click image to view full size file.
Copy number change of EPAS1:
| Dataset | Gene | EntrezID | Gain | Loss | Normal | Detail |
|---|---|---|---|---|---|---|
| GSE15526 | EPAS1 | 2034 | 10 | 1 | 19 | |
| GSE20123 | EPAS1 | 2034 | 9 | 1 | 20 | |
| GSE43470 | EPAS1 | 2034 | 5 | 0 | 38 | |
| GSE46452 | EPAS1 | 2034 | 1 | 4 | 54 | |
| GSE47630 | EPAS1 | 2034 | 7 | 0 | 33 | |
| GSE54993 | EPAS1 | 2034 | 0 | 5 | 65 | |
| GSE54994 | EPAS1 | 2034 | 10 | 0 | 43 | |
| GSE60625 | EPAS1 | 2034 | 0 | 3 | 8 | |
| GSE74703 | EPAS1 | 2034 | 5 | 0 | 31 | |
| GSE74704 | EPAS1 | 2034 | 9 | 1 | 10 | |
| TCGA | EPAS1 | 2034 | 35 | 2 | 59 |
Total number of gains: 91; Total number of losses: 17; Total Number of normals: 380.
Somatic mutations of EPAS1:
Generating mutation plots.
Highly correlated genes for EPAS1:
Showing top 20/310 corelated genes with mean PCC>0.5.
| Gene1 | Gene2 | Mean PCC | Num. Datasets | Num. PCC<0 | Num. PCC>0.5 |
|---|---|---|---|---|---|
| EPAS1 | SEC11A | 0.779036 | 3 | 0 | 3 |
| EPAS1 | AMZ2 | 0.763318 | 3 | 0 | 3 |
| EPAS1 | NLGN4X | 0.73819 | 3 | 0 | 3 |
| EPAS1 | VPS16 | 0.73543 | 3 | 0 | 3 |
| EPAS1 | ZDHHC7 | 0.729846 | 3 | 0 | 3 |
| EPAS1 | RARS2 | 0.722095 | 3 | 0 | 3 |
| EPAS1 | PLEKHM3 | 0.710131 | 3 | 0 | 3 |
| EPAS1 | SKA2 | 0.701405 | 3 | 0 | 3 |
| EPAS1 | BCL6 | 0.698466 | 3 | 0 | 3 |
| EPAS1 | TK2 | 0.691461 | 4 | 0 | 4 |
| EPAS1 | FAM98B | 0.690707 | 3 | 0 | 3 |
| EPAS1 | GALM | 0.685961 | 3 | 0 | 3 |
| EPAS1 | SYK | 0.678681 | 3 | 0 | 3 |
| EPAS1 | CISD3 | 0.678045 | 3 | 0 | 3 |
| EPAS1 | EPM2AIP1 | 0.671048 | 3 | 0 | 3 |
| EPAS1 | PHLDB2 | 0.667958 | 3 | 0 | 3 |
| EPAS1 | GIMAP5 | 0.667903 | 3 | 0 | 3 |
| EPAS1 | ZNF655 | 0.66403 | 4 | 0 | 4 |
| EPAS1 | CCDC93 | 0.663548 | 3 | 0 | 3 |
| EPAS1 | SWAP70 | 0.662874 | 4 | 0 | 3 |
For details and further investigation, click here